Preamble Microsoft 365 tells you SharePoint is being used. It doesn’t tell you *by whom, for … Beyond Built-in Reports: Deep SharePoint Online Monitoring at ScaleRead more
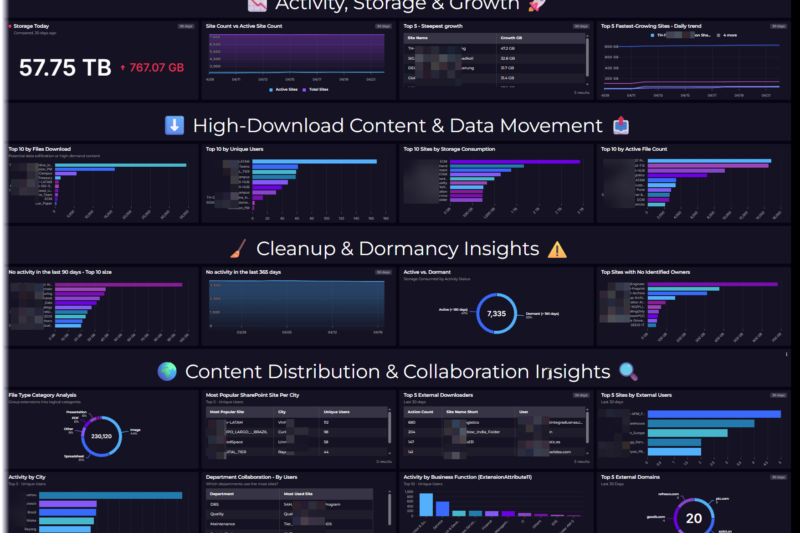
Preamble Microsoft 365 tells you SharePoint is being used. It doesn’t tell you *by whom, for … Beyond Built-in Reports: Deep SharePoint Online Monitoring at ScaleRead more
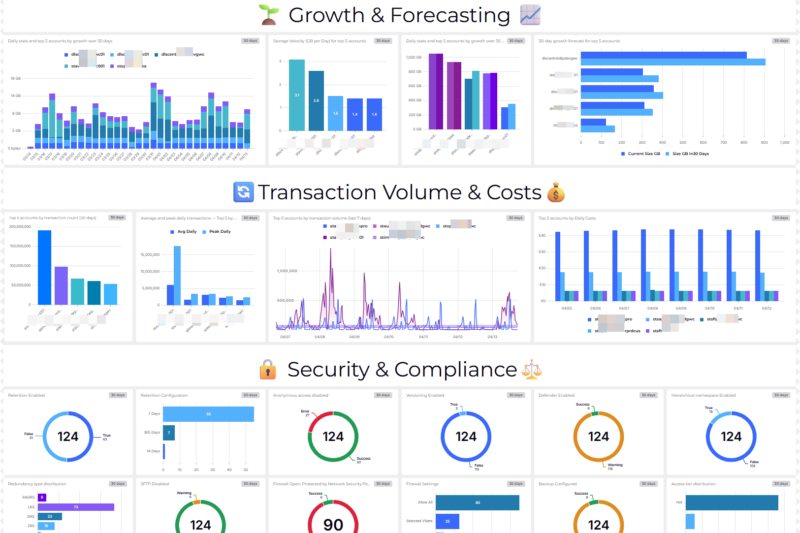
In a nutshell Azure Storage telemetry and configuration data lives in many different places across the … Azure Storage Account InsightsRead more
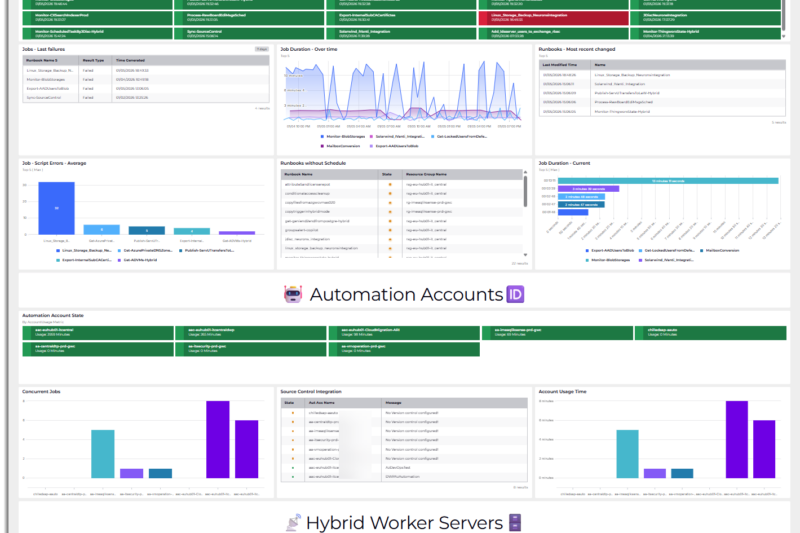
Observability turns scattered telemetry into actionable signals. This post doesn’t walk through building the dashboard UI … Azure Automation Dashboard – Code‑FirstRead more

Learn how I built a clean, insight‑packed Azure Virtual Desktop dashboard using SquaredUp Cloud —powered by … Observability for Azure Virtual DesktopRead more
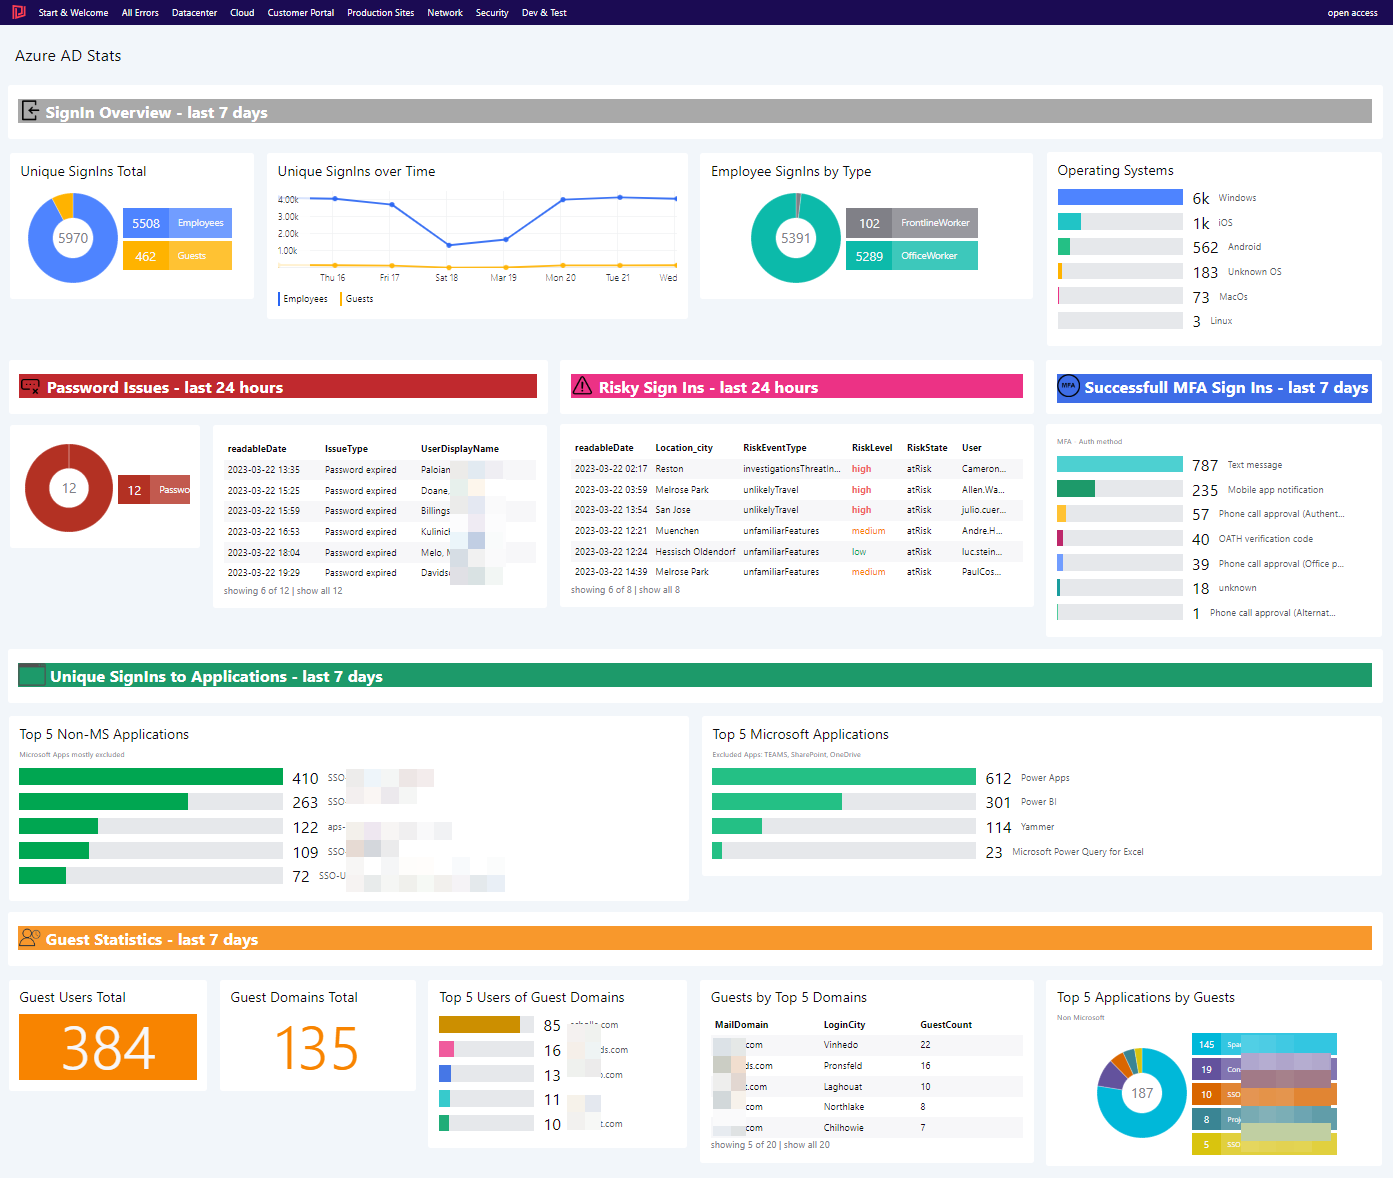
Teaser When Azure AD is configured to record Sign-In activity, #Kusto can be used to gain … Understand your #AzureAD Sign-Ins with #KQLRead more
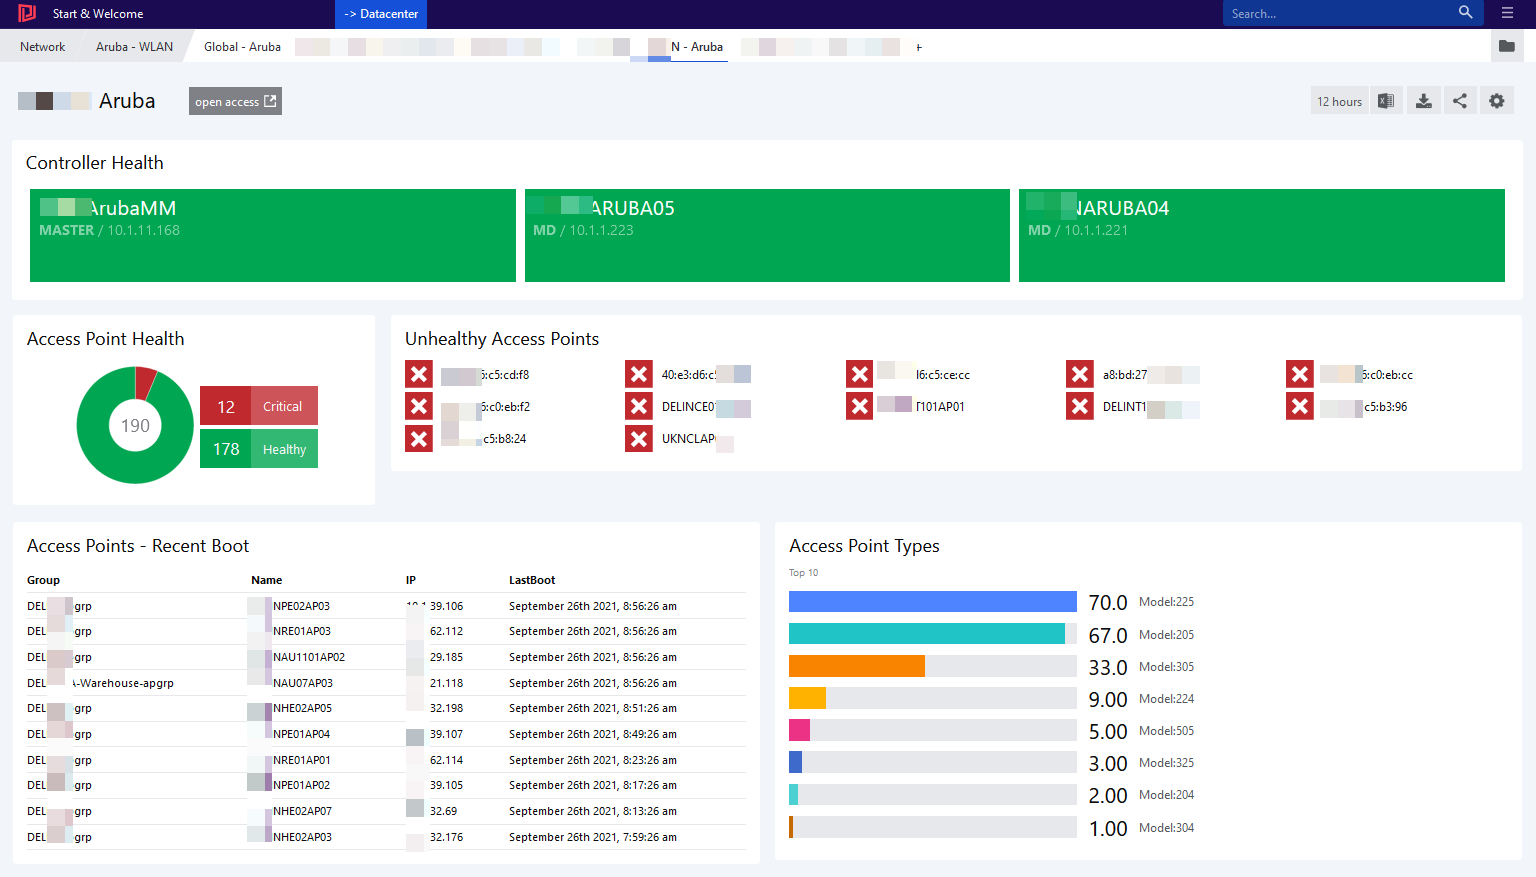
Aruba Wireless technology is one of the market leaders. Squared Up can bring in visibility and … Visualize Aruba Wireless Infrastructure with Squared UpRead more
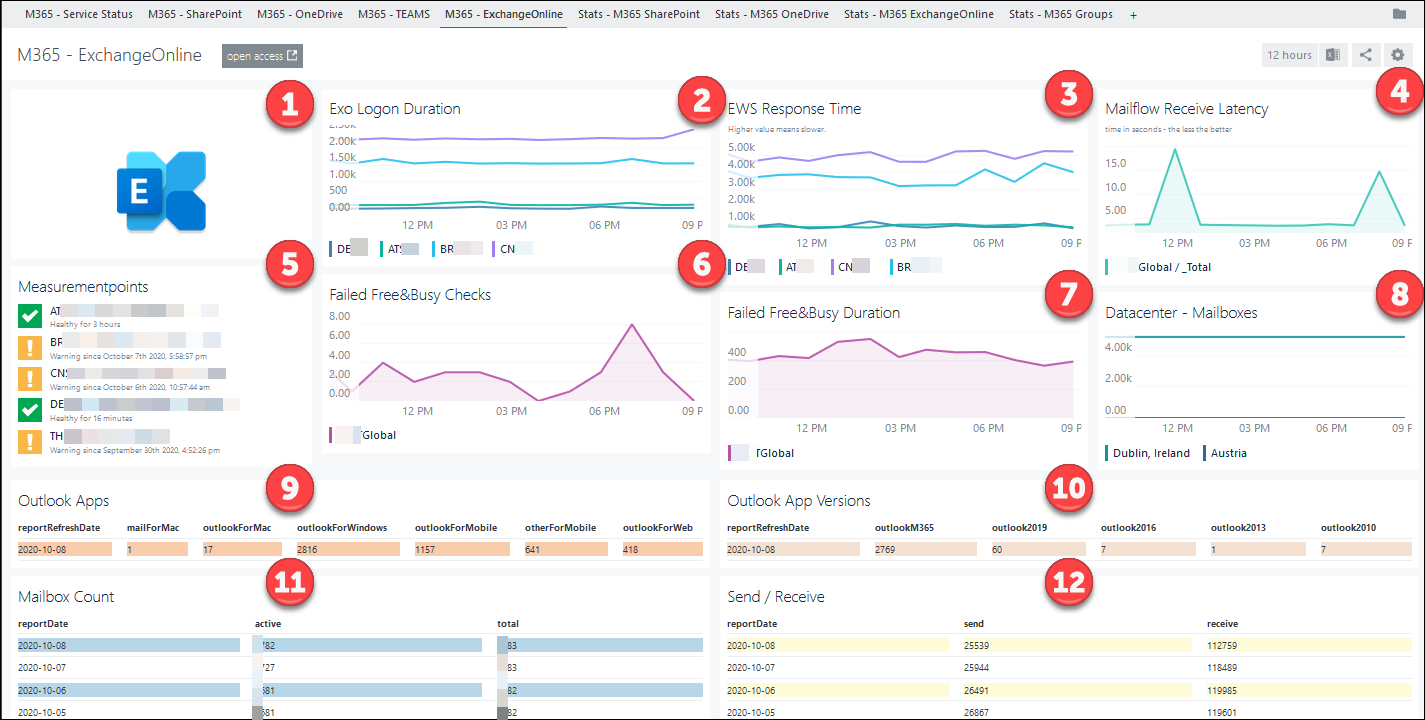
Combining SCOM, NiCE’ Active 365 MP and SquaredUp helps to bring light into your M365 tenant.
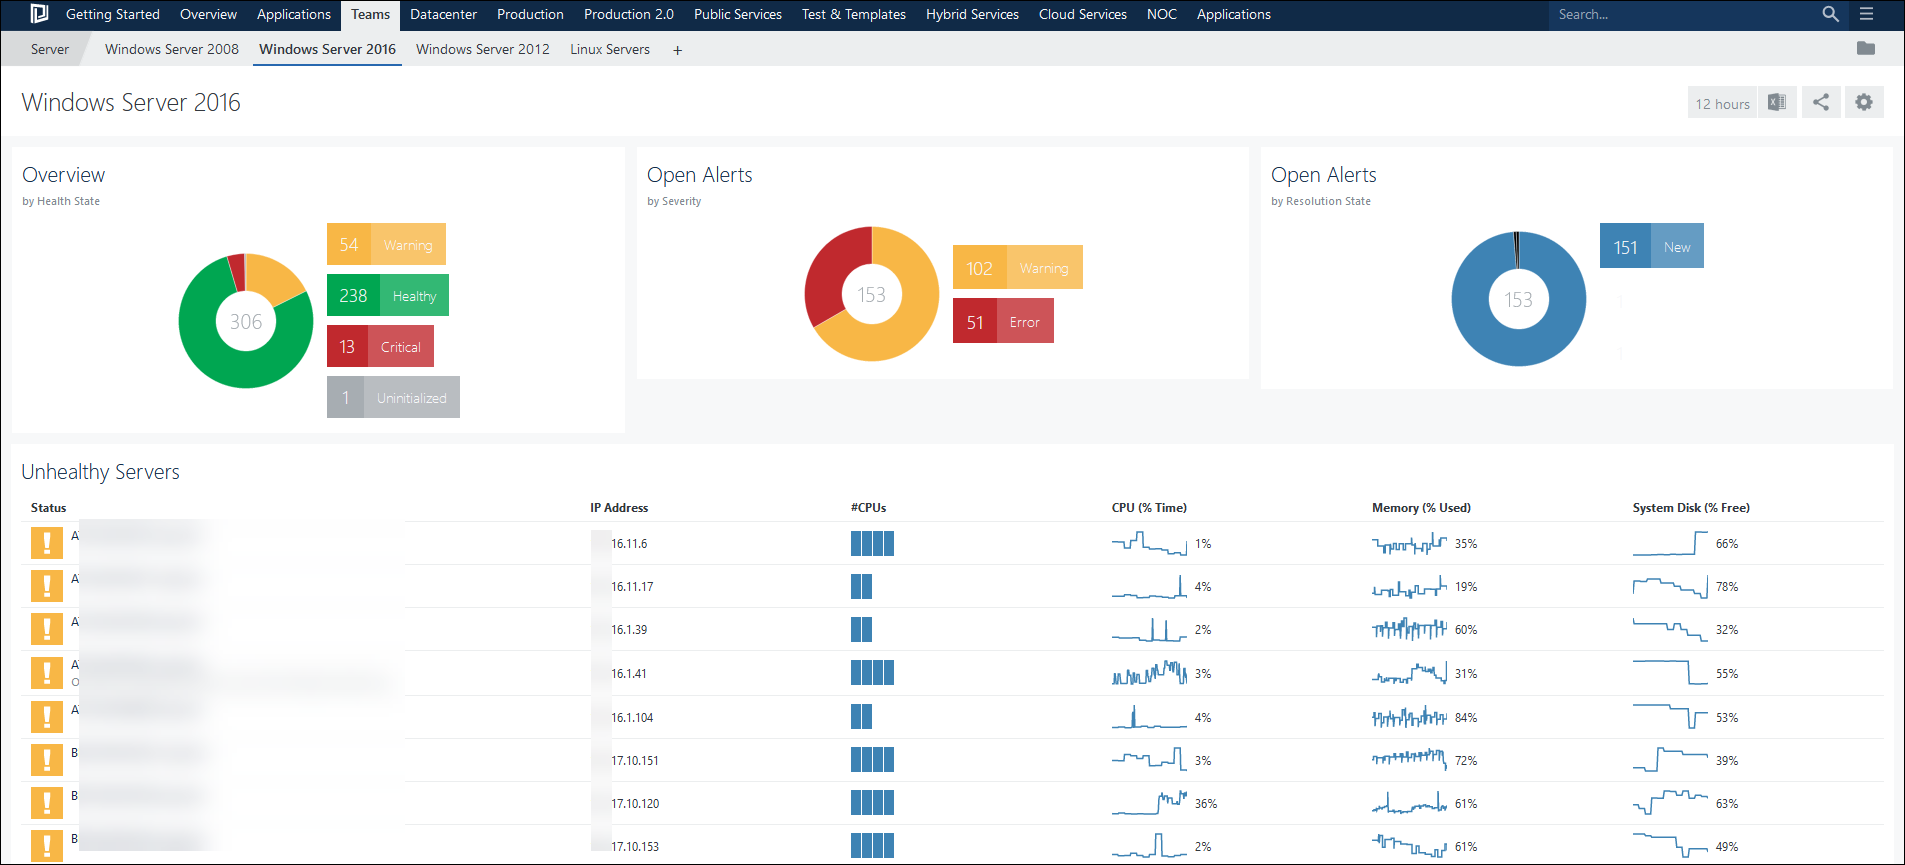
Squared Up is a rich dashboard solution for System Center Operations Manager.
From health state information, over performance data, alerts, SLA-reporting and agent – tasks all can be consumed.
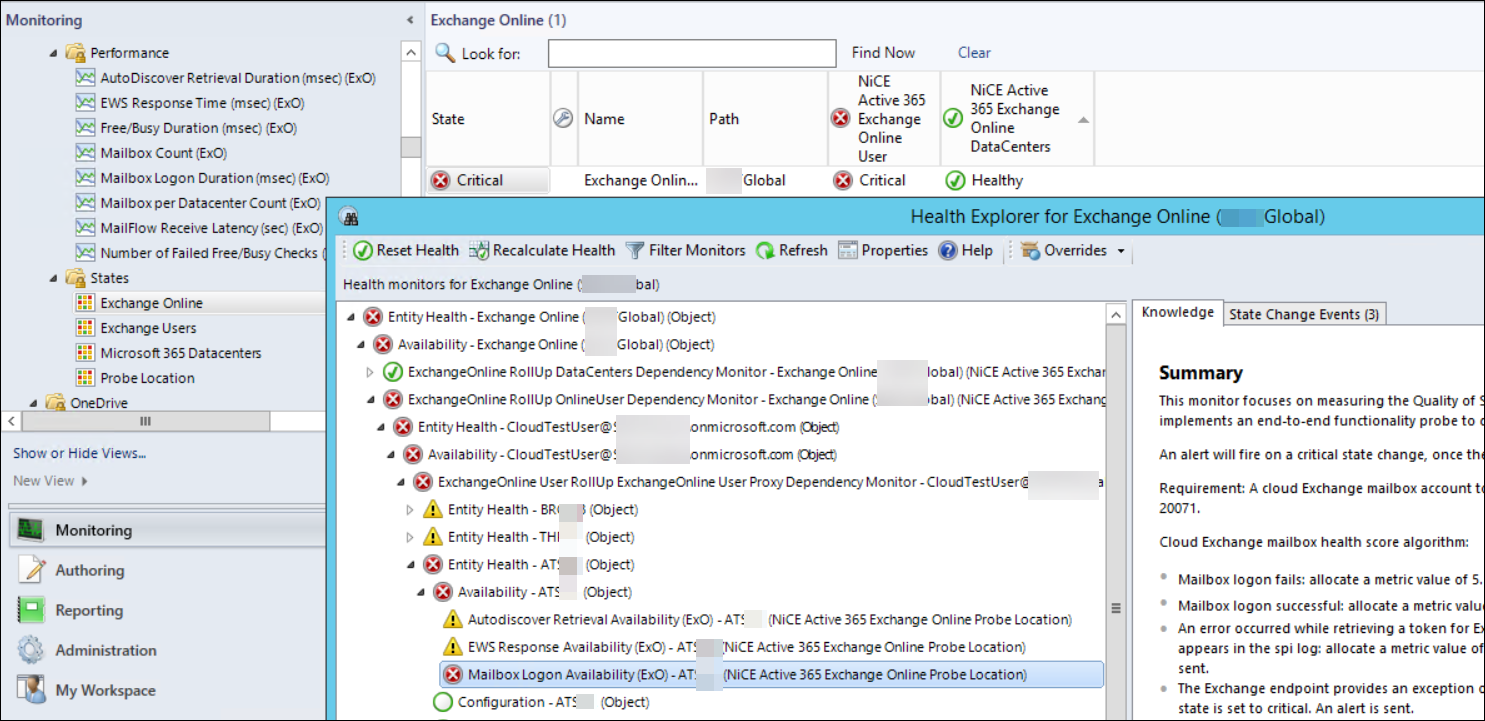
As always with SCOM, the right Management Pack is required 😉
Active 365 MP by NiCE can track and monitor various aspects of the M365 suite.
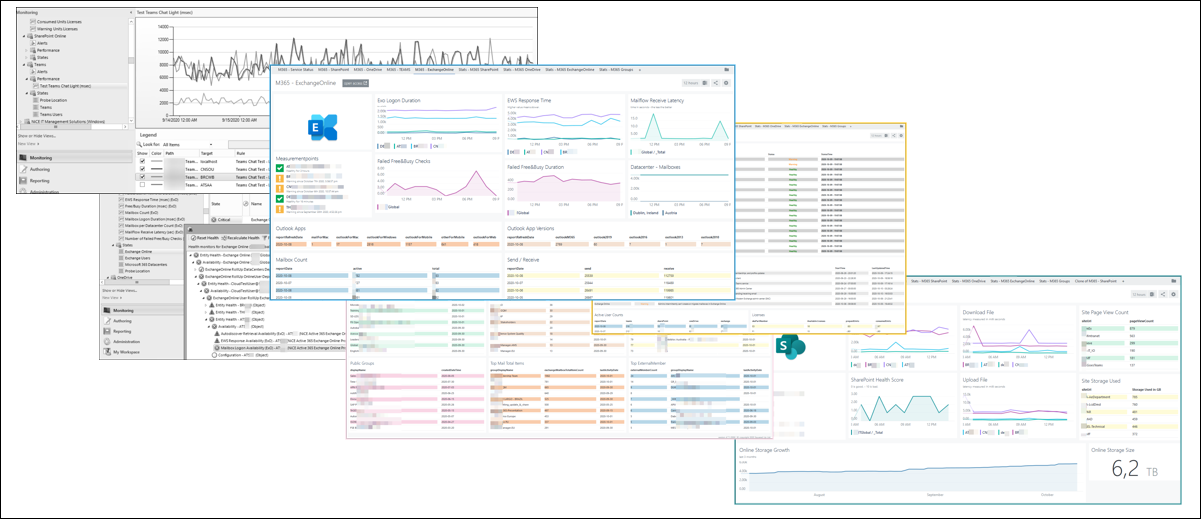
Microsoft 365 is a managed service which offers Exchange, SharePoint, Teams, OneDrive and many more services worldwide. With it, responsibilities of IT staff evolved and changed.
Monitoring however is still a crucial aspect. In this short article, I will explain why SCOM a perfect solution for this is.