Visualize Aruba Wireless Infrastructure with Squared Up

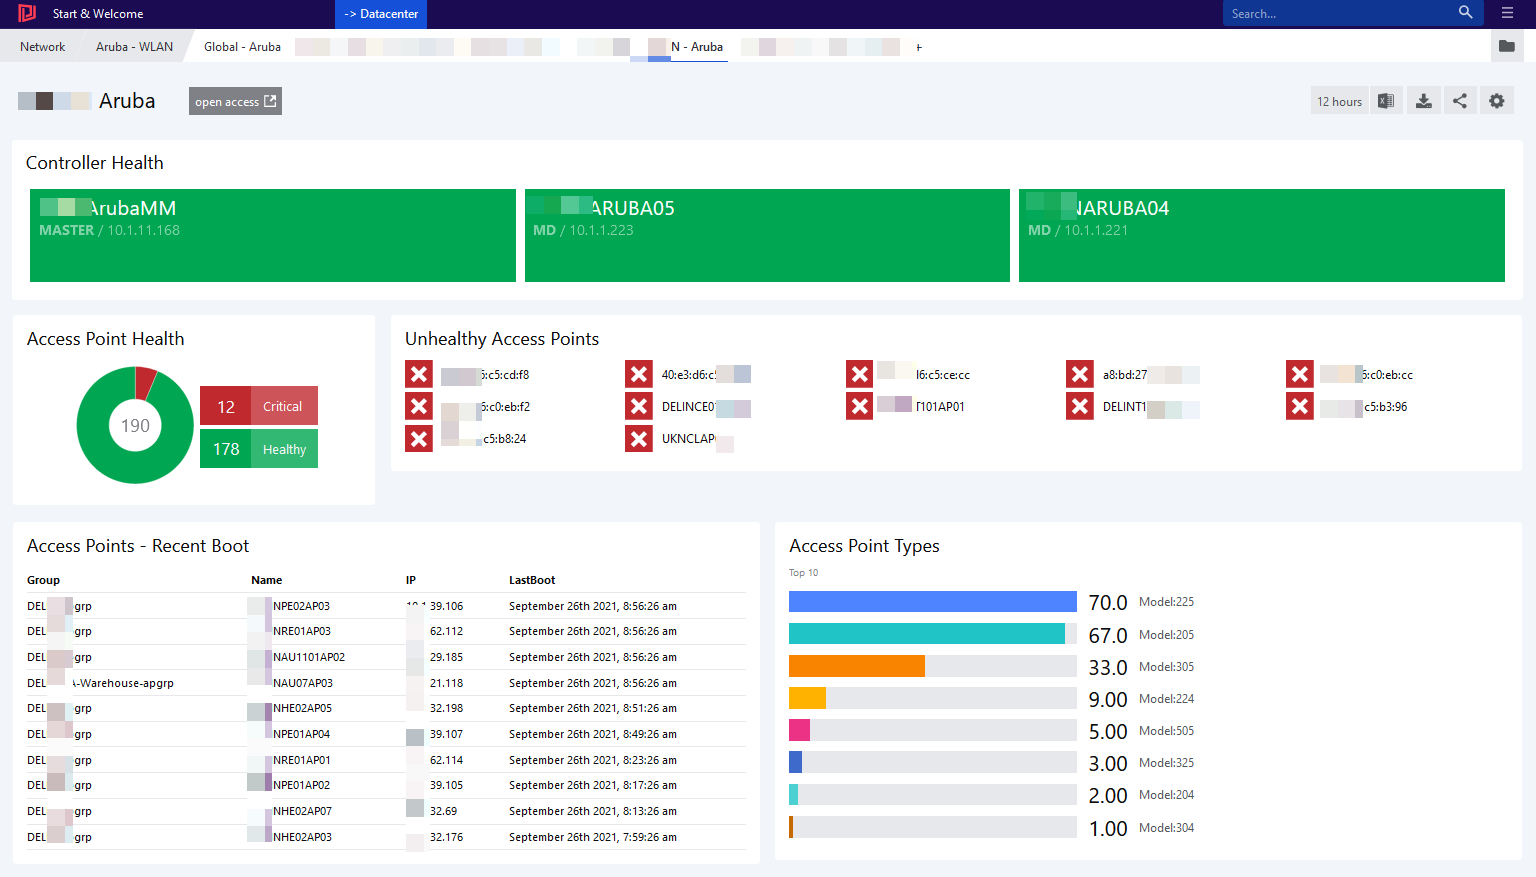
Aruba Wireless technology is one of the market leaders. Squared Up can bring in visibility and reduces the MTTR*.

This post explains by example how to extract, transform, and visualize Aruba data by using the PowerShell and Squared Up.

Introduction

Aruba (part of HP Enterprise) provides wireless LAN solutions for small offices to large enterprise networks. Mobility-controller are used to manage access points centrally. By using master-controller a management hierarchy can be setup by keeping one point of administration.

Network specialists either use command line or the web interface. Automation and programmatic access are given via common REST API.

Squared Up in version 5.3 (Jan 2022) offers many possibilities to retrieve data and visualize it in no time.

Most versatile capability is the native integration of PowerShell. It allows any kind of data transformation or aggregation before passing it the dashboard engine.

Prerequisites

At least Aruba OS 8.5 on the controller and PowerShell 5.1 on the Squared Up server are suggested.

A local user account “aruba_monitor” with password needs to be created on the controller.

Dry Run

Before coming to the details, try if retrieving Aruba information from the Squared Up server works.

Getting all switches:

The script below retrieves all switches ( controller ) and adds state information that is needed for Squared Up. The information is stored in a CSV file which allows instant showing of the information. Use Scheduled Tasks to run the script regularly (e.g. every 5 minutes).

#region PREWORK Disabling the certificate validations
add-type -TypeDefinition @"
    using System.Net;
    using System.Security.Cryptography.X509Certificates;
    public class TrustAllCertsPolicy : ICertificatePolicy {
        public bool CheckValidationResult(
            ServicePoint srvPoint, X509Certificate certificate,
            WebRequest request, int certificateProblem) {
            return true;
        }
    }
"@
[Net.ServicePointManager]::CertificatePolicy = New-Object -TypeName TrustAllCertsPolicy
#endregion PREWORK


$API_BASE_URI    = 'https://your-aruba-master-url'
$DeviceUsername  = 'aruba_monitor'
$DevicePassword  = 'your-password'


$session = Invoke-RestMethod -Uri "${API_BASE_URI}/v1/api/login" -Method Post -Body "username=$DeviceUsername&password=$DevicePassword" -SessionVariable api_session

$sessionID = $session._global_result.UIDARUBA
 

$allSwitches =  Invoke-RestMethod -Uri "${API_BASE_URI}/v1/configuration/showcommand?command=show+switches+all&UIDARUBA=${sessionID}" -WebSession $api_session
$switches = $allSwitches.'All Switches'


$switchList = New-Object -TypeName System.Collections.ArrayList

foreach ($sw in $switches) {

  $stateTmp = ($sw.Status -split ' ')[0]
  $state = 'Healthy'
  if ($stateTmp -ieq 'up') {
    $state = 'Healthy'
  } elseif ($stateTmp -ieq 'down') {
    $state = 'Critical'
  } else {
    $state = 'Warning'
  }

  $swObj = [pscustomobject]@{
    ConfigID           = $sw.'Config ID'
    ConfigSyncTimeSec  = $sw.'Config Sync Time (sec)'
    ConfigurationState = $sw.'Configuration State'
    name               = $sw.Name
    IP                 = $sw.'IP Address'
    Status             = $stateTmp
    Location           = $sw.Location
    Model              = $sw.Model
    SiteCode           = $sw.Name.Substring(0,5).ToUpper()
    Type               = $sw.Type
    State              = $state
  }

  $null = $switchList.Add($swObj)


} #end foreach ($sw in $switches) 


$switchList | Export-Csv -NoTypeInformation -Path C:\temp\aruba_switchlist.csv -Force


#log off – Important as otherwise all sessions will be blocked!
Invoke-RestMethod -Uri "${API_BASE_URI}/v1/api/logout" -Method Post -SessionVariable api_session 

Getting all access points:

For convenience, simply extend the script above ( just before log off section ) the following lines which export all access points. – Some meta information is appended, too:

$allAccessPoints = Invoke-RestMethod -Uri "${API_BASE_URI}/v1/configuration/showcommand?command=show+ap+database&UIDARUBA=${sessionID}" -WebSession $api_session
$accessPoints = $allAccessPoints.'AP Database'


$accessPointList = New-Object -TypeName System.Collections.ArrayList


foreach ($ap in $accessPoints) {

  $switchName = $switches | Where-Object {$_.'IP Address' -eq $ap.'Switch IP'} | Select-Object -ExpandProperty Name
  $siteCode = $switchName.Substring(0,5).ToUpper()

  if ($ap.Status.Length -gt 6) {
    $uptime = ($ap.Status -split ' ')[1]
    $tmpTime = $uptime -replace '[a-z]',''
    $tmpTime2 = $tmpTime -split ':'
    $tmpTime3 = New-TimeSpan -Days $tmpTime2[0] -Hours $tmpTime2[1] -Minutes $tmpTime2[2]
    $lastboot = (Get-Date) - [timespan]$tmpTime3
  } else {
    $uptime = 0 
    $lastboot = 0
  }

  $stateTmp = ($ap.Status -split ' ')[0]
  $state = 'Healthy'
  if ($stateTmp -ieq 'up') {
    $state = 'Healthy'
  } elseif ($stateTmp -ieq 'down') {
    $state = 'Critical'
  } else {
    $state = 'Warning'
  }


  $apObj = [pscustomobject]@{
    apType     = "Model:" + $ap.'AP Type'
    Flags      = $ap.Flags
    Group      = $ap.Group
    Name       = $ap.Name
    IP         = $ap.'IP Address'
    Status     = $stateTmp
    UpTime     = $uptime
    LastBoot   = $lastboot
    SwIP       = $ap.'Switch IP'
    SiteCode   = $siteCode
    SwitchName = $switchName
    State      = $state
  }

  $null = $accessPointList.Add($apObj)

} # end foreach ($ap in $accessPoints)


$accessPointList  | Export-Csv -NoTypeInformation -Path C:\temp\aruba_accesspointlist.csv -Force

Verifying results

Running the scripts should result in having two CSV files in C:\Temp. If this is the case, proceed.

E.g. aruba_switchlist.csv

"ConfigID","ConfigSyncTimeSec","ConfigurationState","name","IP","Status","Location","Model","SiteCode","Type","State"
"1872","0","UPDATE SUCCESSFUL","ArubaMM","10.1.11.168","up","Building1.floor1","ArubaMM-VA","DEL","master","Healthy"
"1872","10","UPDATE SUCCESSFUL","ARUBA02","172.16.2.240","up","Building1.floor1","Aruba7030","ATS","MD","Healthy"

E.g. aruba_accesspointlist.csv

"apType","Flags","Group","Name","IP","Status","UpTime","LastBoot","SwIP","SiteCode","SwitchName","State"
"Model:224","U2","default","40:e3:d6:c5:cd:f8","10.1.21.104","Down","0","0","10.1.1.221","DELIN","DELINARUBA04","Critical"
"Model:515","2","AEDUB-apgrp","AEDUBAP02","172.31.20.21","Up","9d:4h:22m:2s","2/3/2022 11:11:24 AM","172.31.2.90","AEDUB","AEDUBARUBA01","Healthy"

Overview Dashboard

Create the overview dashboard that is shown at the beginning. Create a new dashboard.

Section: Controller Health

Start with PowerShell (Status – Block):

Enter the script and apply filtering in needed:

Finalize by adding a sub label:

Section: Access Points Health

Start with PowerShell (Donut):

Enter the script and apply filter is required:

Apply custom color formatting:

Section: Unhealthy Access Points

Start with PowerShell (Status -Icons)

Enter the script and filter if needed:

Pick the proper label:

Section: Access Points – Recent Boots

Start with PowerShell (Grid):

Enter the script:

Configure the grid columns:

Section: Access Points Types

Start with PowerShell (bar graph):

Enter the script and filter if needed:

Set the label property:

Enable multiple colors:

Conclusion

This example has shown you how to easily create a dashboard of your Aruba infrastructure.

Btw: Squared Up Community Edition is free! – Find it on: https://squaredup.com/community-edition/

One more thing …

Another great use case is using the PowerShell (Status Icon) tile in combination with your building layout. – See your access points health and know exactly where they are:

* MTTR = Mean Time To Repair