Monitor O365 with SCOM 4 (4 of 4)

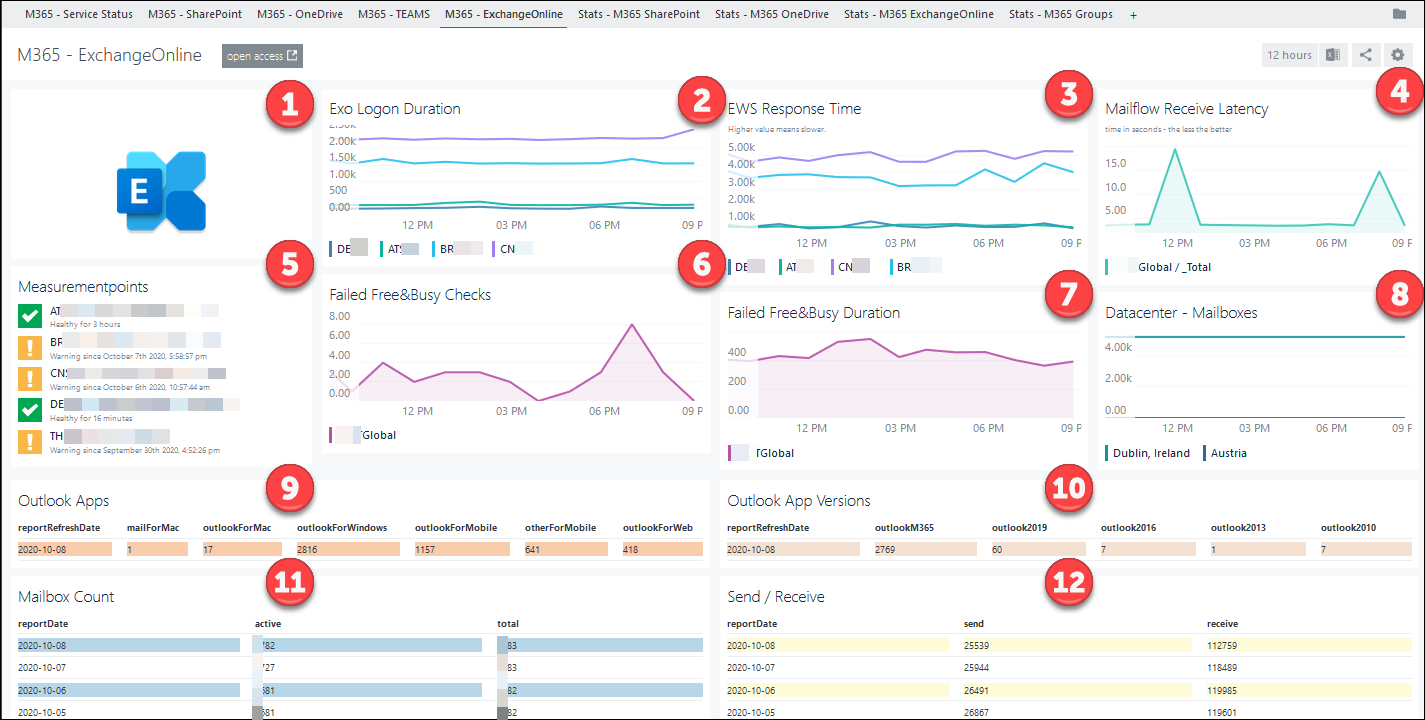
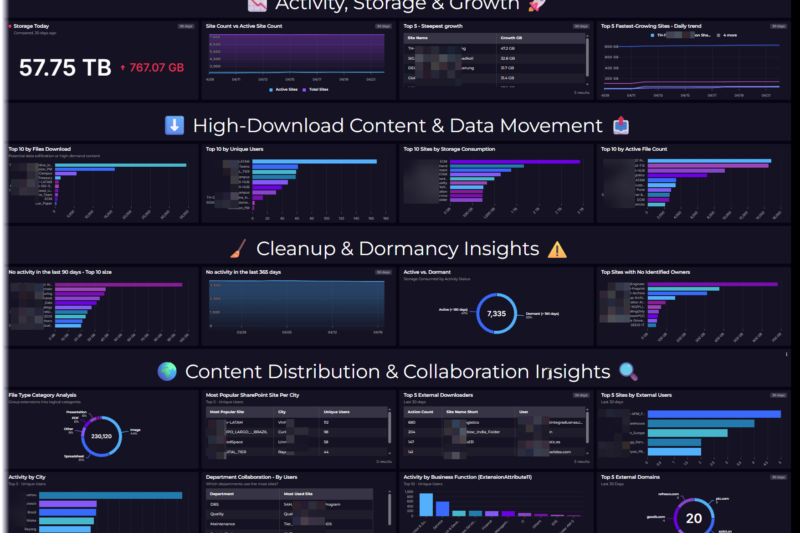
Combining SCOM, NiCE’ Active 365 MP and SquaredUp helps to bring light into your M365 tenant.

O365 Cockpit – SCOM+NiCE+Squared Up

The remaining section shines in the light of Governance. It provides a few dashboard ideas and explains used components in detail.

M365 – Service Status

Consolidates various aspects about service health, incidents and consumption.

(1) The top section shows health state about all services used in your tenant including the last update time.
(2) In the middle information about current incidents are shown.

Both leverages the Office 365 Management API


(3) on the foot left active user count vs. services are shown
(4) least, at the left corner license consumption details are displayed

Both tiles at bottom leverage GRAPH API requests.

Alternating colors require the Data On Demand Addendum – Management Pack for Windows Computers which is available through the free Management Pack catalog

Squared Up – Tile details:

ParameterValue
ClientIdYour client ID
ClientSecretYour client Secret
TenantIdYour tenant ID
SCOM-TaskGet-MSO365MgmtData
GraphQry/ServiceComms/CurrentStatus
DisplayItemNumber30
FilteredBy$_.Workload -ine ’Bookings’
SortedByStatus
(1) Services
ParameterValue
ClientIdYour client ID
ClientSecretYour client Secret
TenantIdYour tenant ID
TaskGet-MSO365MgmtData
GraphQry/ServiceComms/Messages
DisplayItemNumber30
FilteredBy$_.MessageType -ieq ‘incident’ -and (-not $_.EndTime)
SortedByStartTime
(2) Incidents
ParameterValue
ClientIdYour client ID
ClientSecretYour client Secret
TenantIdYour tenant ID
TaskGet-MSGraphBetaData
GraphQry/reports/getOffice365ActiveUserCounts(period=‘D7‘)?$format=application/json
SortedByreportDate
SortDescendingtrue
Active User Counts
ParameterValue
ClientIdYour client ID
ClientSecretYour client Secret
TenantIdYour tenant ID
TaskGet-MSGraphBetaData
GraphQry/subscribedSkus
DisplayItemNumber20
FilteredBy$_skuePartNumber -ine ‘MCOEV’ …
SortedByconsumedUnits
SortDescendingtrue
Licenses

M365 – SharePoint Online

Combines SharePoint Online availability and performance aspects measured from different proxy locations with details about recent most frequently visited and highest storage consumption.

Squared Up – Tile details:

(1) SharePoint Online logo
Web Tile / HTML /

<center> <img src="https://squaredup.ourdomain.abc/CustomPicturesForSquaredUp/SharePoint.png" height=240 width=240 valign=top> </center> 

(2) Reachability
Status / Icons / Scope: Class NiCE Active 365 SharePoint Probe Location

(3) Logon Duration
Performance / Line Graph / Scope: Class NiCE Active 365 SharePoint Probe Location / Metric SharePointOnline – LogOn Duration (Web)

(4) SharePoint Health Score
Performance / Line Graph / Scope: Class NiCE Active 365 SharePoint Online / Metric (SharePointOnline – Upload File (Web) (( display name bug ))

(5) Download File
Performance / Line Graph / Scope: Class NiCE Active 365 SharePoint Probe Location / Metric SharePointOnline – Download File (Web)

(6) Upload File
Performance / Line Graph / Scope: Class NiCE Active 365 SharePoint Probe Location / Metric SharePointOnline – Upload File (Web)

ParameterValue
ClientIdYour client ID
ClientSecretYour client Secret
TenantIdYour tenant ID
TaskGet-MSGraphBetaData
GraphQry/reports/getSharePointSiteUsageDetail(period=’D7′)?`$format=application/json&amp;`$select=siteUrl,isDeleted,pageViewCount,lastActivityDate,storageUsedInBytes,storageAllocatedInBytes,visitedPageCount,&`$top=5000
DisplayItemNumber6
FilteredBy$_.isDeleted -ne $True -and $_.siteUrl -notMatch ‘yourTenantName-my’ -and $_.siteUrl -ine ‘https://yourTenantName.sharepoint.com/’
SortedBypageViewCount
SortDescendingTrue
(7) Site Page View Count
ParameterValue
ClientIdYour client ID
ClientSecretYour client Secret
TenantIdYour tenant ID
TaskGet-MSGraphBetaData
GraphQry/reports/getSharePointSiteUsageDetail(period=’D7′)?`$format=application/json&amp;`$select=siteUrl,isDeleted,lastActivityDate,storageUsedInBytes,storageAllocatedInBytes,visitedPageCount,&amp;`$top=5000
DisplayItemNumber6
FilteredBy$_.isDeleted -ne $True
SortedBystorageUsedInBytes
SortDescendingtrue
(8) Site Storage Used

(9) Online Storage Growth
Performance / Line Graph / Scope: Class NiCE Active 365 SharePoint Online / Metric SharePointOnline – SpO Storage Size / TimeFrame: 3 Months

(10) Online Storage Size
Performance / Scalar / Scope Class NiCE Active 365 SharePoint Online / Metric SharePointOnline – SpO Storage Size / Scalar: value formatter: {{Math.floor(value).toString().substring(0,1)}},{{Math.floor(value).toString().substring(1,2)}}

Stats M365 – SharePoint Online

Shows top storage consuming sites, number of available and active sites, recent create team sites and sites which are most often visited.

Squared Up – Tile details:

ParameterValue
ClientIdYour client ID
ClientSecretYour client Secret
TenantIdYour tenant ID
TaskGet-MSGraphBetaData
GraphQry/reports/getSharePointSiteUsageDetail(period=’D30′)?`$format=application/json&`$select=siteUrl,isDeleted,lastActivityDate,storageUsedInBytes,&`$top=5000
DisplayItemNumber30
FilteredBy$_.isDeleted -ne $True
SortedBystorageUsedInBytes
SortDescendingTrue
Storage used in GB{{parseInt(value.storageUsedInBytes/1024000000)}}  
(1) Site Storage Used
ParameterValue
ClientIdYour client ID
ClientSecretYour client Secret
TenantIdYour tenant ID
TaskGet-MSGraphBetaData
GraphQry/reports/getSharePointSiteUsageSiteCounts(period=’D30′)?$format=application/json
DisplayItemNumber30
FilteredBy$_.isDeleted -ne $True
SortedByreportDate
(2) Site Number Report
ParameterValue
ClientIdYour client ID
ClientSecretYour client Secret
TenantIdYour tenant ID
TaskGet-MSGraphBetaData
GraphQry/groups?`$format=application/json&amp;`$filter=groupTypes/any(c:c+eq+’Unified’)
DisplayItemNumber30
SortedBycreatedDateTime
(3) Team Sites Created
ParameterValue
ClientIdYour client ID
ClientSecretYour client Secret
TenantIdYour tenant ID
TaskGet-MSGraphBetaData
GraphQry/reports/getSharePointSiteUsageDetail(period=’D30′)?`$format=application/json&amp;`$select=siteUrl,isDeleted,pageViewCount,lastActivityDate,storageUsedInBytes,storageAllocatedInBytes,visitedPageCount&amp;`$top=5000
DisplayItemNumber30
FilteredBy$_.isDeleted -ne $True -and $_.siteUrl -notMatch ‘yourtenantName-my’ -and $_.siteUrl -ine ‘https://yourtenantName.sharepoint.com/’
SortedBypageViewCount
(4) Site Page View Count

M365 – ExchangeOnline

Combines Exchange Online availability and performance aspects measured from different proxy locations with details about connecting Outlook Apps and Version with recent Mailbox Count- and Send / Receive statistics

Squared Up – Tile details:

(1) Exchange Online logo
Web Tile / HTML /

<center> <img src="https://squaredup.ourdomain.abc/CustomPicturesForSquaredUp/Exchange.png" height=240 width=240 valign=top> </center>

(2) Exo Logon Duration
Performance / Line Graph / Scope: Class NiCE Active 365 Component / Metric Exchange Online – Mailbox LogOn Duration (ExO)

(3) EWS Response time
Performance / Line Graph / Scope: Class NiCE Active 365 Exchange Online Probe Location/ Metric ExchangeOnline – EWS Response Time (ExO) Milliseconds

(4) Mailflow Receive Latency
Performance / Line Graph / Scope: Class NiCE Active 365 Exchange Online / Metric ExchangeOnline – Mail Flow Receive Latency (ExO)

(5) Measurementpoints
Status / Icons / Scope: Class NiCE Active 365 Exchange Online Probe Location

(6) Failed Free&Busy Checks
Performance / Line Graph / Scope: Class NiCE Active 365 Exchange Online / Metric ExchangeOnline – Number of Failed Free/Busy Checks (ExO)

(7) Failed Free&Busy Duration
Performance / Line Graph / Scope: Class NiCE Active 365 Exchange Online / Metric ExchangeOnline – Failed Free/Busy Duration using Test Accounts (ExO)

(8) Datacenter – Mailboxes
Performance / Line Graph / Scope: Class NiCE Active 365 Exchange Online Datacenter / Metric ExchangeOnline – Datacenter Mailbox Count (ExO)

ParameterValue
ClientIdYour client ID
ClientSecretYour client Secret
TenantIdYour tenant ID
TaskGet-MSGraphBetaData
GraphQry/reports/getEmailAppUsageAppsUserCounts(period=’D7′)?`&amp;$format=application/json
(9) Outlook Apps
ParameterValue
ClientIdYour client ID
ClientSecretYour client Secret
TenantIdYour tenant ID
TaskGet-MSGraphBetaData
GraphQry/reports/getEmailAppUsageVersionsUserCounts(period=’D7′)?`&amp;$format=application/json
(10) Outlook App Versions
ParameterValue
ClientIdYour client ID
ClientSecretYour client Secret
TenantIdYour tenant ID
TaskGet-MSGraphBetaData
GraphQry/reports/getMailboxUsageMailboxCounts(period=’D30′)?$format=application/json
DisplayItemNumber5
(11) Mailbox Count
ParameterValue
ClientIdYour client ID
ClientSecretYour client Secret
TenantIdYour tenant ID
TaskGet-MSGraphBetaData
GraphQry/reports/getEmailActivityCounts(period=’D7′)?$format=application/json
DisplayItemNumber5
(12) Send / Receive

Stats M365 – Groups

Shows recent created groups, those with most members, publicly available most storage consuming and more.

Squared Up – Tile details:

ParameterValue
ClientIdYour client ID
ClientSecretYour client Secret
TenantIdYour tenant ID
TaskGet-MSGraphBetaData
GraphQry/groups?`$format=application/json&amp;`$filter=groupTypes/any(c:c+eq+’Unified’)
SortDescendingTrue
SortedBycreatedDateTime
DisplayItemNumber10
(1) Recent Created
ParameterValue
ClientIdYour client ID
ClientSecretYour client Secret
TenantIdYour tenant ID
TaskGet-MSGraphBetaData
GraphQry/reports/getOffice365GroupsActivityDetail(period=’D7′)?$format=application/json
FilteredBy$_.isDeleted -ne ‘False’
SortedByexchangeMailboxStorageUsedInBytes
SortDecendingtrue
(2) Top Mail Storage Consumption
ParameterValue
ClientIdYour client ID
ClientSecretYour client Secret
TenantIdYour tenant ID
TaskGet-MSGraphBetaData
GraphQry/reports/getOffice365GroupsActivityDetail(period=’D7′)?$format=application/json
FilteredBy$_.isDeleted -ne ‘False’
SortedBymemberCount
SortDecendingtrue
(3) Top Member
ParameterValue
ClientIdYour client ID
ClientSecretYour client Secret
TenantIdYour tenant ID
TaskGet-MSGraphBetaData
GraphQry/groups?`$format=application/json&amp;`$filter=groupTypes/any(c:c+eq+’Unified’)
SortDescendingTrue
SortedBycreatedDateTime
DisplayItemNumber10
FilteredBy$_.visibility -ne ‘private’
(4) Public Groups
ParameterValue
ClientIdYour client ID
ClientSecretYour client Secret
TenantIdYour tenant ID
TaskGet-MSGraphBetaData
GraphQry/reports/getOffice365GroupsActivityDetail(period=’D7′)?$format=application/json
SortDescendingTrue
SortedByexchangeMailboxTotalItemCount
FilteredBy$_.isDeleted -ne ‘False’
(5) Top Mail Total Items
ParameterValue
ClientIdYour client ID
ClientSecretYour client Secret
TenantIdYour tenant ID
TaskGet-MSGraphBetaData
GraphQry/reports/getOffice365GroupsActivityDetail(period=’D7′)?$format=application/json
FilteredBy$_.isDeleted -ne ‘False’
SortedByexternalMemberCount
SortDescendingtrue
(6) Top External Member