Monitor O365 with SCOM 4 (4 of 4)

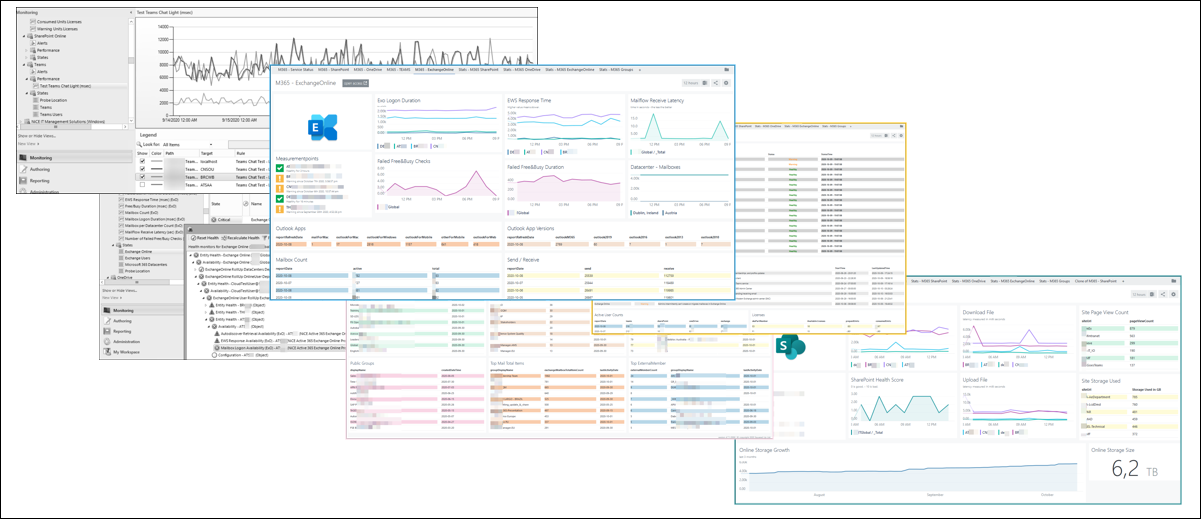
Combining SCOM, NiCE’ Active 365 MP and SquaredUp helps to bring light into your M365 tenant.

O365 Cockpit – SCOM+NiCE+Squared Up

The remaining section shines in the light of Governance. It provides a few dashboard ideas and explains used components in detail.

M365 – Service Status

Consolidates various aspects about service health, incidents and consumption.

(1) The top section shows health state about all services used in your tenant including the last update time.
(2) In the middle information about current incidents are shown.

Both leverages the Office 365 Management API


(3) on the foot left active user count vs. services are shown
(4) least, at the left corner license consumption details are displayed

Both tiles at bottom leverage GRAPH API requests.

Alternating colors require the Data On Demand Addendum – Management Pack for Windows Computers which is available through the free Management Pack catalog

Squared Up – Tile details:

ParameterValue
ClientIdYour client ID
ClientSecretYour client Secret
TenantIdYour tenant ID
SCOM-TaskGet-MSO365MgmtData
GraphQry/ServiceComms/CurrentStatus
DisplayItemNumber30
FilteredBy$_.Workload -ine ’Bookings’
SortedByStatus
(1) Services
ParameterValue
ClientIdYour client ID
ClientSecretYour client Secret
TenantIdYour tenant ID
TaskGet-MSO365MgmtData
GraphQry/ServiceComms/Messages
DisplayItemNumber30
FilteredBy$_.MessageType -ieq ‘incident’ -and (-not $_.EndTime)
SortedByStartTime
(2) Incidents
ParameterValue
ClientIdYour client ID
ClientSecretYour client Secret
TenantIdYour tenant ID
TaskGet-MSGraphBetaData
GraphQry/reports/getOffice365ActiveUserCounts(period=‘D7‘)?$format=application/json
SortedByreportDate
SortDescendingtrue
Active User Counts
ParameterValue
ClientIdYour client ID
ClientSecretYour client Secret
TenantIdYour tenant ID
TaskGet-MSGraphBetaData
GraphQry/subscribedSkus
DisplayItemNumber20
FilteredBy$_skuePartNumber -ine ‘MCOEV’ …
SortedByconsumedUnits
SortDescendingtrue
Licenses

M365 – SharePoint Online

Combines SharePoint Online availability and performance aspects measured from different proxy locations with details about recent most frequently visited and highest storage consumption.

Squared Up – Tile details:

(1) SharePoint Online logo
Web Tile / HTML /

<center> <img src="https://squaredup.ourdomain.abc/CustomPicturesForSquaredUp/SharePoint.png" height=240 width=240 valign=top> </center> 

(2) Reachability
Status / Icons / Scope: Class NiCE Active 365 SharePoint Probe Location

(3) Logon Duration
Performance / Line Graph / Scope: Class NiCE Active 365 SharePoint Probe Location / Metric SharePointOnline – LogOn Duration (Web)

(4) SharePoint Health Score
Performance / Line Graph / Scope: Class NiCE Active 365 SharePoint Online / Metric (SharePointOnline – Upload File (Web) (( display name bug ))

(5) Download File
Performance / Line Graph / Scope: Class NiCE Active 365 SharePoint Probe Location / Metric SharePointOnline – Download File (Web)

(6) Upload File
Performance / Line Graph / Scope: Class NiCE Active 365 SharePoint Probe Location / Metric SharePointOnline – Upload File (Web)

ParameterValue
ClientIdYour client ID
ClientSecretYour client Secret
TenantIdYour tenant ID
TaskGet-MSGraphBetaData
GraphQry/reports/getSharePointSiteUsageDetail(period=’D7′)?`$format=application/json&amp;`$select=siteUrl,isDeleted,pageViewCount,lastActivityDate,storageUsedInBytes,storageAllocatedInBytes,visitedPageCount,&`$top=5000
DisplayItemNumber6
FilteredBy$_.isDeleted -ne $True -and $_.siteUrl -notMatch ‘yourTenantName-my’ -and $_.siteUrl -ine ‘https://yourTenantName.sharepoint.com/’
SortedBypageViewCount
SortDescendingTrue
(7) Site Page View Count
ParameterValue
ClientIdYour client ID
ClientSecretYour client Secret
TenantIdYour tenant ID
TaskGet-MSGraphBetaData
GraphQry/reports/getSharePointSiteUsageDetail(period=’D7′)?`$format=application/json&amp;`$select=siteUrl,isDeleted,lastActivityDate,storageUsedInBytes,storageAllocatedInBytes,visitedPageCount,&amp;`$top=5000
DisplayItemNumber6
FilteredBy$_.isDeleted -ne $True
SortedBystorageUsedInBytes
SortDescendingtrue
(8) Site Storage Used

(9) Online Storage Growth
Performance / Line Graph / Scope: Class NiCE Active 365 SharePoint Online / Metric SharePointOnline – SpO Storage Size / TimeFrame: 3 Months

(10) Online Storage Size
Performance / Scalar / Scope Class NiCE Active 365 SharePoint Online / Metric SharePointOnline – SpO Storage Size / Scalar: value formatter: {{Math.floor(value).toString().substring(0,1)}},{{Math.floor(value).toString().substring(1,2)}}

Stats M365 – SharePoint Online

Shows top storage consuming sites, number of available and active sites, recent create team sites and sites which are most often visited.

Squared Up – Tile details:

ParameterValue
ClientIdYour client ID
ClientSecretYour client Secret
TenantIdYour tenant ID
TaskGet-MSGraphBetaData
GraphQry/reports/getSharePointSiteUsageDetail(period=’D30′)?`$format=application/json&`$select=siteUrl,isDeleted,lastActivityDate,storageUsedInBytes,&`$top=5000
DisplayItemNumber30
FilteredBy$_.isDeleted -ne $True
SortedBystorageUsedInBytes
SortDescendingTrue
Storage used in GB{{parseInt(value.storageUsedInBytes/1024000000)}}  
(1) Site Storage Used
ParameterValue
ClientIdYour client ID
ClientSecretYour client Secret
TenantIdYour tenant ID
TaskGet-MSGraphBetaData
GraphQry/reports/getSharePointSiteUsageSiteCounts(period=’D30′)?$format=application/json
DisplayItemNumber30
FilteredBy$_.isDeleted -ne $True
SortedByreportDate
(2) Site Number Report
ParameterValue
ClientIdYour client ID
ClientSecretYour client Secret
TenantIdYour tenant ID
TaskGet-MSGraphBetaData
GraphQry/groups?`$format=application/json&amp;`$filter=groupTypes/any(c:c+eq+’Unified’)
DisplayItemNumber30
SortedBycreatedDateTime
(3) Team Sites Created
ParameterValue
ClientIdYour client ID
ClientSecretYour client Secret
TenantIdYour tenant ID
TaskGet-MSGraphBetaData
GraphQry/reports/getSharePointSiteUsageDetail(period=’D30′)?`$format=application/json&amp;`$select=siteUrl,isDeleted,pageViewCount,lastActivityDate,storageUsedInBytes,storageAllocatedInBytes,visitedPageCount&amp;`$top=5000
DisplayItemNumber30
FilteredBy$_.isDeleted -ne $True -and $_.siteUrl -notMatch ‘yourtenantName-my’ -and $_.siteUrl -ine ‘https://yourtenantName.sharepoint.com/’
SortedBypageViewCount
(4) Site Page View Count

M365 – ExchangeOnline

Combines Exchange Online availability and performance aspects measured from different proxy locations with details about connecting Outlook Apps and Version with recent Mailbox Count- and Send / Receive statistics

Squared Up – Tile details:

(1) Exchange Online logo
Web Tile / HTML /

<center> <img src="https://squaredup.ourdomain.abc/CustomPicturesForSquaredUp/Exchange.png" height=240 width=240 valign=top> </center>

(2) Exo Logon Duration
Performance / Line Graph / Scope: Class NiCE Active 365 Component / Metric Exchange Online – Mailbox LogOn Duration (ExO)

(3) EWS Response time
Performance / Line Graph / Scope: Class NiCE Active 365 Exchange Online Probe Location/ Metric ExchangeOnline – EWS Response Time (ExO) Milliseconds

(4) Mailflow Receive Latency
Performance / Line Graph / Scope: Class NiCE Active 365 Exchange Online / Metric ExchangeOnline – Mail Flow Receive Latency (ExO)

(5) Measurementpoints
Status / Icons / Scope: Class NiCE Active 365 Exchange Online Probe Location

(6) Failed Free&Busy Checks
Performance / Line Graph / Scope: Class NiCE Active 365 Exchange Online / Metric ExchangeOnline – Number of Failed Free/Busy Checks (ExO)

(7) Failed Free&Busy Duration
Performance / Line Graph / Scope: Class NiCE Active 365 Exchange Online / Metric ExchangeOnline – Failed Free/Busy Duration using Test Accounts (ExO)

(8) Datacenter – Mailboxes
Performance / Line Graph / Scope: Class NiCE Active 365 Exchange Online Datacenter / Metric ExchangeOnline – Datacenter Mailbox Count (ExO)

ParameterValue
ClientIdYour client ID
ClientSecretYour client Secret
TenantIdYour tenant ID
TaskGet-MSGraphBetaData
GraphQry/reports/getEmailAppUsageAppsUserCounts(period=’D7′)?`&amp;$format=application/json
(9) Outlook Apps
ParameterValue
ClientIdYour client ID
ClientSecretYour client Secret
TenantIdYour tenant ID
TaskGet-MSGraphBetaData
GraphQry/reports/getEmailAppUsageVersionsUserCounts(period=’D7′)?`&amp;$format=application/json
(10) Outlook App Versions
ParameterValue
ClientIdYour client ID
ClientSecretYour client Secret
TenantIdYour tenant ID
TaskGet-MSGraphBetaData
GraphQry/reports/getMailboxUsageMailboxCounts(period=’D30′)?$format=application/json
DisplayItemNumber5
(11) Mailbox Count
ParameterValue
ClientIdYour client ID
ClientSecretYour client Secret
TenantIdYour tenant ID
TaskGet-MSGraphBetaData
GraphQry/reports/getEmailActivityCounts(period=’D7′)?$format=application/json
DisplayItemNumber5
(12) Send / Receive

Stats M365 – Groups

Shows recent created groups, those with most members, publicly available most storage consuming and more.

Squared Up – Tile details:

ParameterValue
ClientIdYour client ID
ClientSecretYour client Secret
TenantIdYour tenant ID
TaskGet-MSGraphBetaData
GraphQry/groups?`$format=application/json&amp;`$filter=groupTypes/any(c:c+eq+’Unified’)
SortDescendingTrue
SortedBycreatedDateTime
DisplayItemNumber10
(1) Recent Created
ParameterValue
ClientIdYour client ID
ClientSecretYour client Secret
TenantIdYour tenant ID
TaskGet-MSGraphBetaData
GraphQry/reports/getOffice365GroupsActivityDetail(period=’D7′)?$format=application/json
FilteredBy$_.isDeleted -ne ‘False’
SortedByexchangeMailboxStorageUsedInBytes
SortDecendingtrue
(2) Top Mail Storage Consumption
ParameterValue
ClientIdYour client ID
ClientSecretYour client Secret
TenantIdYour tenant ID
TaskGet-MSGraphBetaData
GraphQry/reports/getOffice365GroupsActivityDetail(period=’D7′)?$format=application/json
FilteredBy$_.isDeleted -ne ‘False’
SortedBymemberCount
SortDecendingtrue
(3) Top Member
ParameterValue
ClientIdYour client ID
ClientSecretYour client Secret
TenantIdYour tenant ID
TaskGet-MSGraphBetaData
GraphQry/groups?`$format=application/json&amp;`$filter=groupTypes/any(c:c+eq+’Unified’)
SortDescendingTrue
SortedBycreatedDateTime
DisplayItemNumber10
FilteredBy$_.visibility -ne ‘private’
(4) Public Groups
ParameterValue
ClientIdYour client ID
ClientSecretYour client Secret
TenantIdYour tenant ID
TaskGet-MSGraphBetaData
GraphQry/reports/getOffice365GroupsActivityDetail(period=’D7′)?$format=application/json
SortDescendingTrue
SortedByexchangeMailboxTotalItemCount
FilteredBy$_.isDeleted -ne ‘False’
(5) Top Mail Total Items
ParameterValue
ClientIdYour client ID
ClientSecretYour client Secret
TenantIdYour tenant ID
TaskGet-MSGraphBetaData
GraphQry/reports/getOffice365GroupsActivityDetail(period=’D7′)?$format=application/json
FilteredBy$_.isDeleted -ne ‘False’
SortedByexternalMemberCount
SortDescendingtrue
(6) Top External Member

Monitor O365 with SCOM 3 (3 of 4)

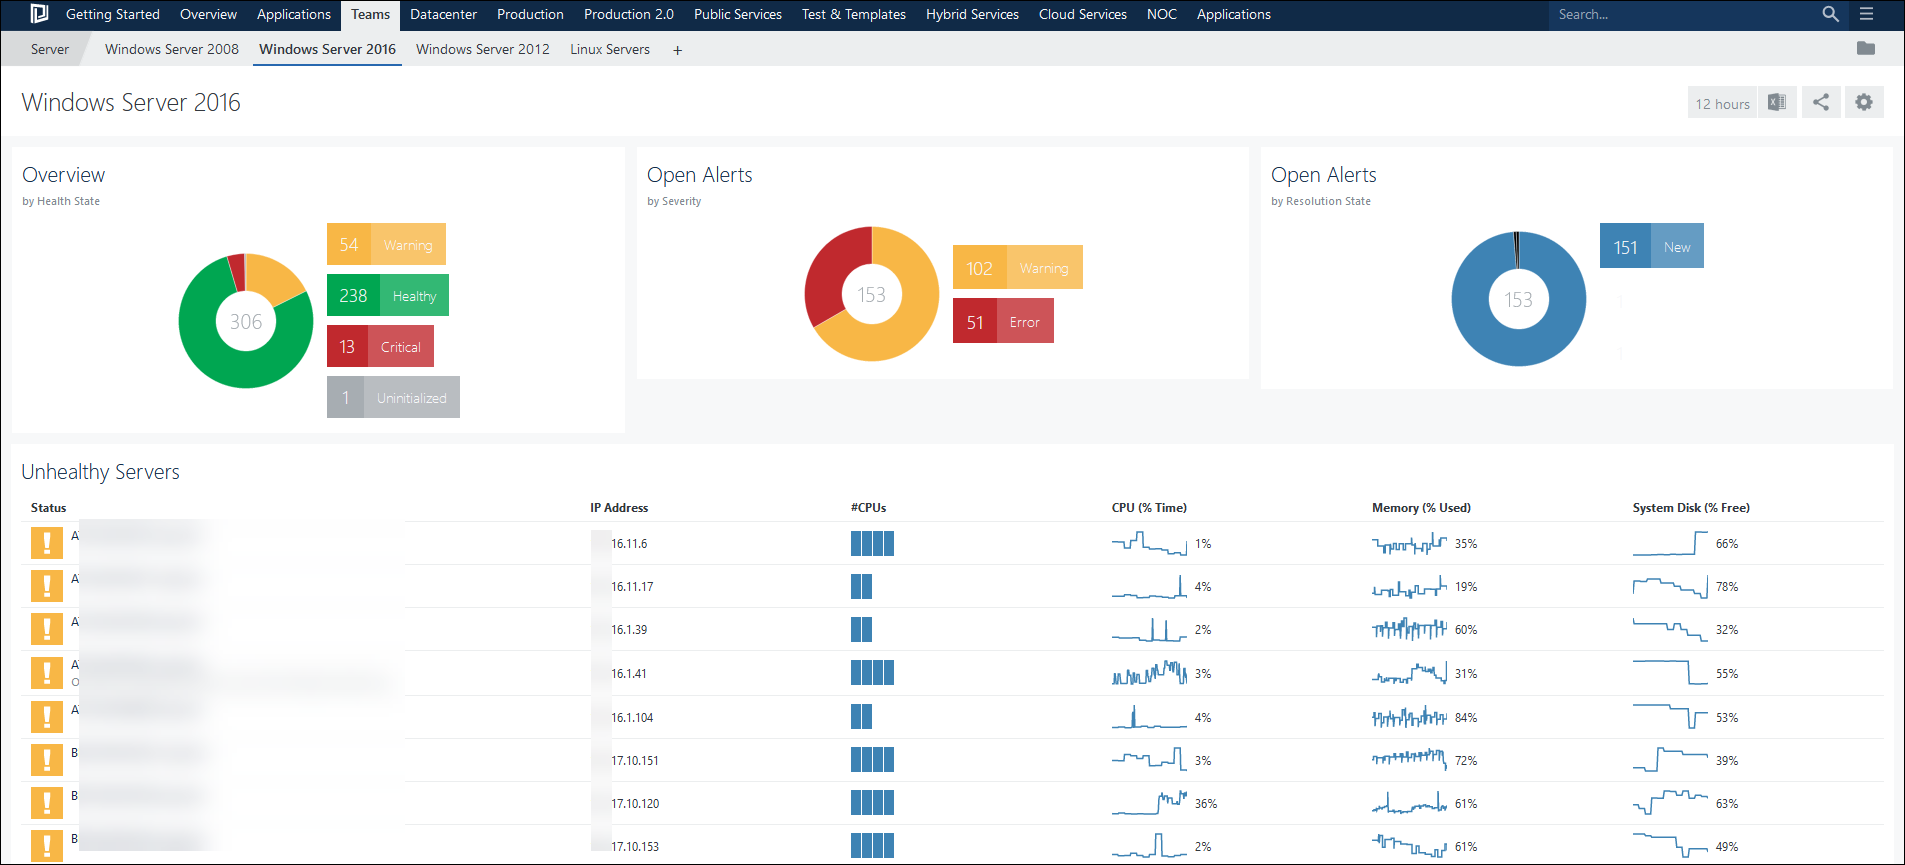
Squared Up is a rich dashboard solution for System Center Operations Manager.

From health state information, over performance data, alerts, SLA-reporting and agent – tasks all can be consumed.

The Visualization Layer

By providing great visualizations, interactive drill downs and many interfaces it helps to engage application owners, help desk, sysadmins, developers and even business aka end-users.

Direct integrations for REST-APIs, MS-SQL, Visio Layouts, Graphics, Websites, Azure – AppInsights, Azure – Log Analytics, Service Now and native HTML 5 support converts it to a central monitoring cockpit – “one pane of glass”.

Building dashboards is a very intuitive either via Drag & Drop or for advanced users by editing JSON within the browser directly.

Beside the excellent support for customers, and a forum offers a place for asking questions around SCOM, Azure Monitor and Squared Up itself of cause.

Squared Up & NiCE

Below, a few screenshots taken from customers’ environment. It uses NiCE’ starter dashboards.

M365 Service Availability and Alerts
M365 Service – End User Performance

Squared Up – More examples

To have a better idea what else can be done with proper dashboards a few more examples:

MS SQL Server 2014 as overview with Top N statistics in dark theme.
Dashboards for key users and an application specialists bringing Devices with IT in relation.
Another dashboards providing Application layer information and Server KPIs together.

Good to know

Note: By the time of writing, the Squared Up for SCOM is version 4.8.1 which was released in  October 2020.

Start by watching a few videos on Squared Ups Youtube channel: https://www.youtube.com/channel/UCJDfdB-kYP9gycVk_KTtn0Q 

Once you have some idea, download the free trial and install it with a few clicks.
Download: https://download.squaredup.com/product-releases/squaredup-for-scom/

Monitor O365 with SCOM 2 (2 of 4)

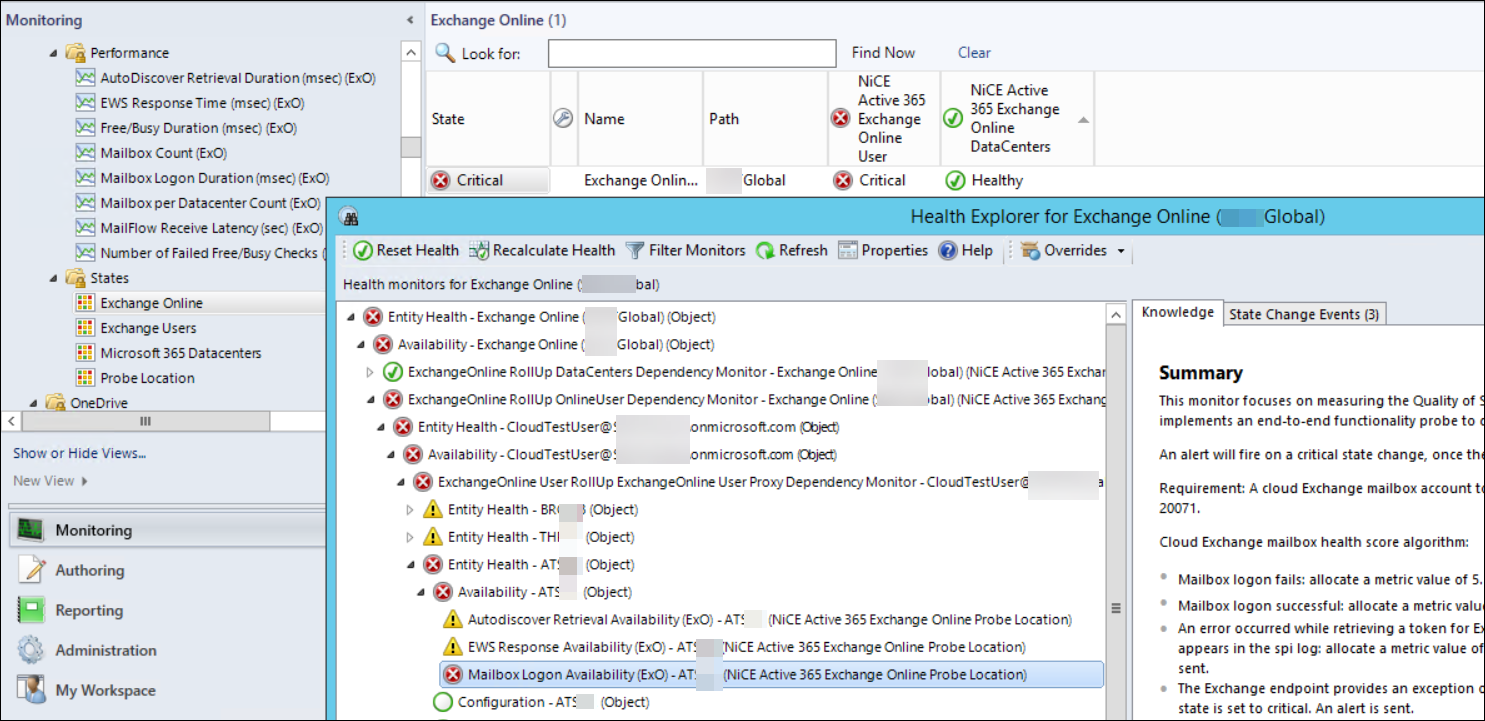
As always with SCOM, the right Management Pack is required 😉

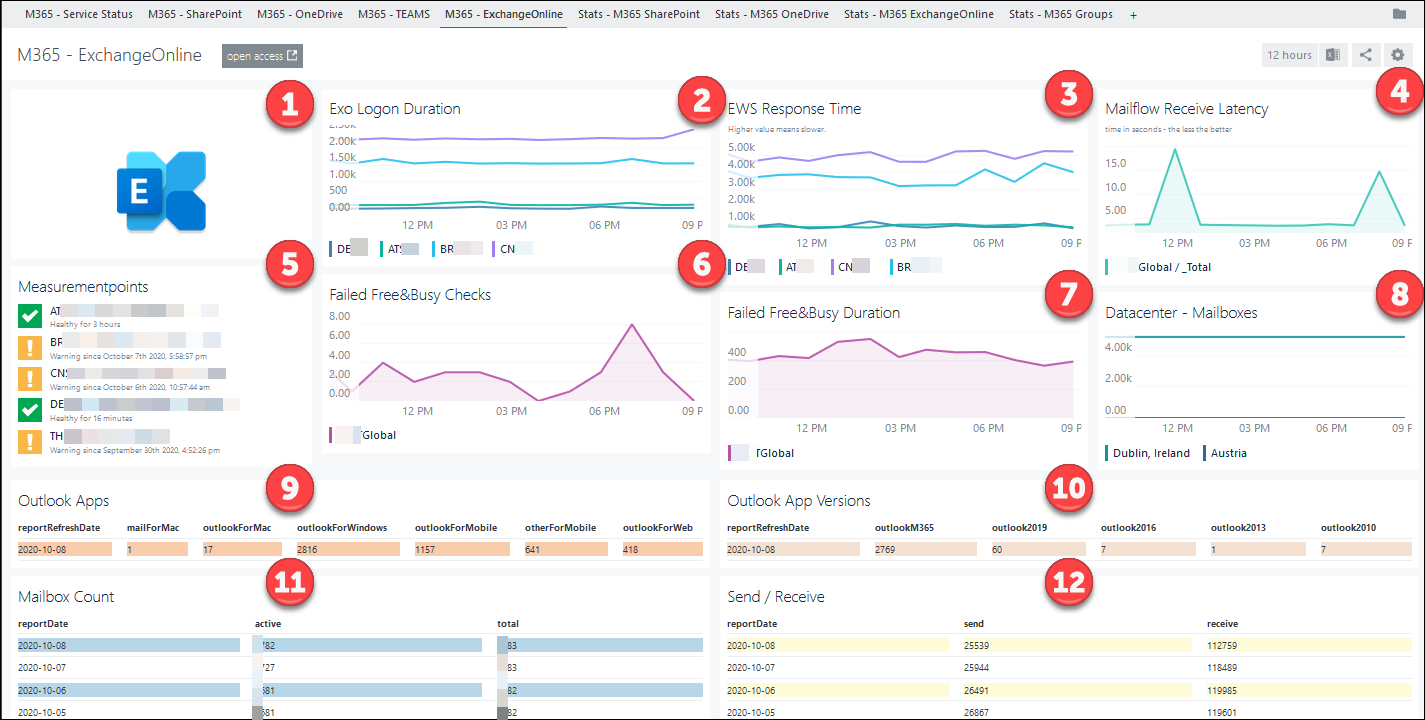
Active 365 MP by NiCE can track and monitor various aspects of the M365 suite.

The Management Pack

Core is a small executable runs on an OpsMgr Management Server or a OpsMgr – Gateway and performs the tests and synthetic transactions.
Only a few configuration steps are required 🙂

Active 365 MP Architecture

Two different monitoring modes are available.
If all Mailboxes have been already migrated, Online only Mode is the correct option. – Both support proxies. The architecture looks as below:

If Mailbox migration is still ongoing – or if some Exchange resources need to be kept on-premises, the hybrid mode fits.

Discovery

To make SCOM aware of your M365 tenant, some preparation steps are required.

User accounts with permissions on a SharePoint site, OneDrive and a Mailbox are needed. Additional permissions are configured within Azure Active Directory / Enterprise Applications.

Information about the user accounts need to be stored in configuration files.

Monitors

After details about the M365 tenant have been discovered, corresponding objects are created and appear in the diagram vies. Monitors can be enabled to perform many different tests to ensure and measure service availability.

M365 / Exchange (ExO pure or Hybrid)
– EWS Response Availability / Time (msec)
– Autodiscover Retrieval Availability
– Mailbox Logon Availability / Duration
– Free / Busy Check
– Mailbox Send & Receive Availability
– Mailbox Receive Latency
– Autodiscover Retrieval Duration
– Service Health Status  
M365 / SharePoint Online
– SpO Logon Latency
– SpO File Up- and Download Check
– SpO Log On Latency
– SpO Health Score
– Request Duration
– IIS Request Latency
– SpO Site Availability
– SpO Storage Usage (GB) Summary
– SpO Service Health Status  
M365 / OneDrive
– OneDrive Log On Latency
– OneDrive File Up- and Download Check
– OneDrive Availability
– OneDrive Service Health Status    
M365 / Teams
– Monitor Teams Chat
– Test LightTeam Chat Availability
– Team Service Health Status  

M365 Monitors – All Services Health Rollups

M365 Monitors – All Services Health Rollups
All M365 Services health rollups of all configured monitors with proxies to simulate different (user-) locations.

M365 – Exchange – Health State and Rollup

Monitors allow customization of thresholds as the default do not suit every environment. If needed, alerting can be enabled to notify about a decreasing performance or loss of service.

Performance Rules

Most transactions that are realized as a Monitor also store the retrieved value and allow reporting via graph plotting and understand trends.

E.g. Rules track Receive Latency, File Up- and Download Time and Request Duration

On Tenant Level:
– Active M365 License Units
– Consumed M365 License Units
– Warning M365 License Units
– Active Users
– Available M365 Licenses
– Identity Service Health, MDM Service Health, M365 Portal Health, M365 Client Application Health, Subscription Health, Number of ExO Mailboxes and others

On Services Level:
M365 – Teams Chat – Performance from 3 Proxy locations

This rule performs simplified test of Teams Chat features using the Graph API

M365 – Exchange Online – Number of Failed Free Busy checks

This rule performs simplified test of Teams Chat features using the Graph APIThis performance rule measures the quality of service (QOS) of the Exchange Online tenant by probing different Exchange Online Mailboxes for availability using resource sharing.

M365 – SharePoint Online – Upload speed from 3 Proxy locations

This performance rule tests upload file to SharePointSiteCollection via Web API

Proxy Locations

To simulate the speed and connectivity from different points in the organization, proxy locations can be configured. As the name states, it is based on web-proxy services that need to be stored in a configuration file.

Based on this information then, tests and probes are sent via the web-proxies, too.

Good to know

Note: By the time of writing, the Active 365 MP is version 3.1. At October 2020 NiCE released already version 3.2!

Download: https://www.nice.de/active-365-mp/

Monitor O365 with SCOM 1 (1 of 4)

Microsoft 365 is a managed service which offers Exchange, SharePoint, Teams, OneDrive and many more services worldwide. With it, responsibilities of IT staff evolved and changed.

Monitoring however is still a crucial aspect. In this short article, I will explain why SCOM a perfect solution for this is.

Monitoring – What and Why?

With M365, IT staff do not need to take care anymore of VMs, Windows patching, configuring the global mail-routing or managing the SharePoint farm. Microsoft is doing it all, so why bother with monitoring?

Although all runs in the cloud, these are still usual applications. They have bugs, they fail from time to time, respond slowly and perhaps behave weird. – All like before 😉

You might have found you already in the situation that a user called and complained about poor SharePoint performance. Another user called and mentioned that the whole Australian team cannot make Teams calls. Perhaps the secretary of the CEO called nervously mentioning she can’t book appointments because Free & Busy is not working well.

Microsoft plays an open deck here and shares news about outages with world. – There is a twitter account which tells things like:

Microsoft 365 Status @MSFT365Status | 2020-07-14
We’re investigating an issue affecting access to SharePoint Online and OneDrive for Business that is primarily impacting customers in EMEA. Additional details can be found in the admin center under SP218450 and OD218456.

In the M365 Admin portal we have a section about “Service Health”. In it we can find messages like:

A very limited number of users may intermittently be unable to access Exchange Online via any connection method

… but is that affecting us in this moment?

So, we can only look sad and tell our users’ that we’re opening a ticket? Luckily, we can do more 🙂

Requirements

Your environment needs to be at least running SCOM 2012 R2. Either a Management Server or a SCOM- Gateway needs to be able to reach Microsoft via Internet. – Proxies are supported, too.

The hard monitoring work is done by NiCE Active 365 MP. The beautiful visualizations are leverage Squared Up for SCOM. – Last piece is the free Data On Demand Management Pack ( always up to date via MP Catalog ) which is used to retrieve M365 meta information to provide more context.

Good to know

Using Squared Up’s Open Access dashboards can be consumed by every user.
No licenses are required. 🙂