Understand your #AzureAD Sign-Ins with #KQL

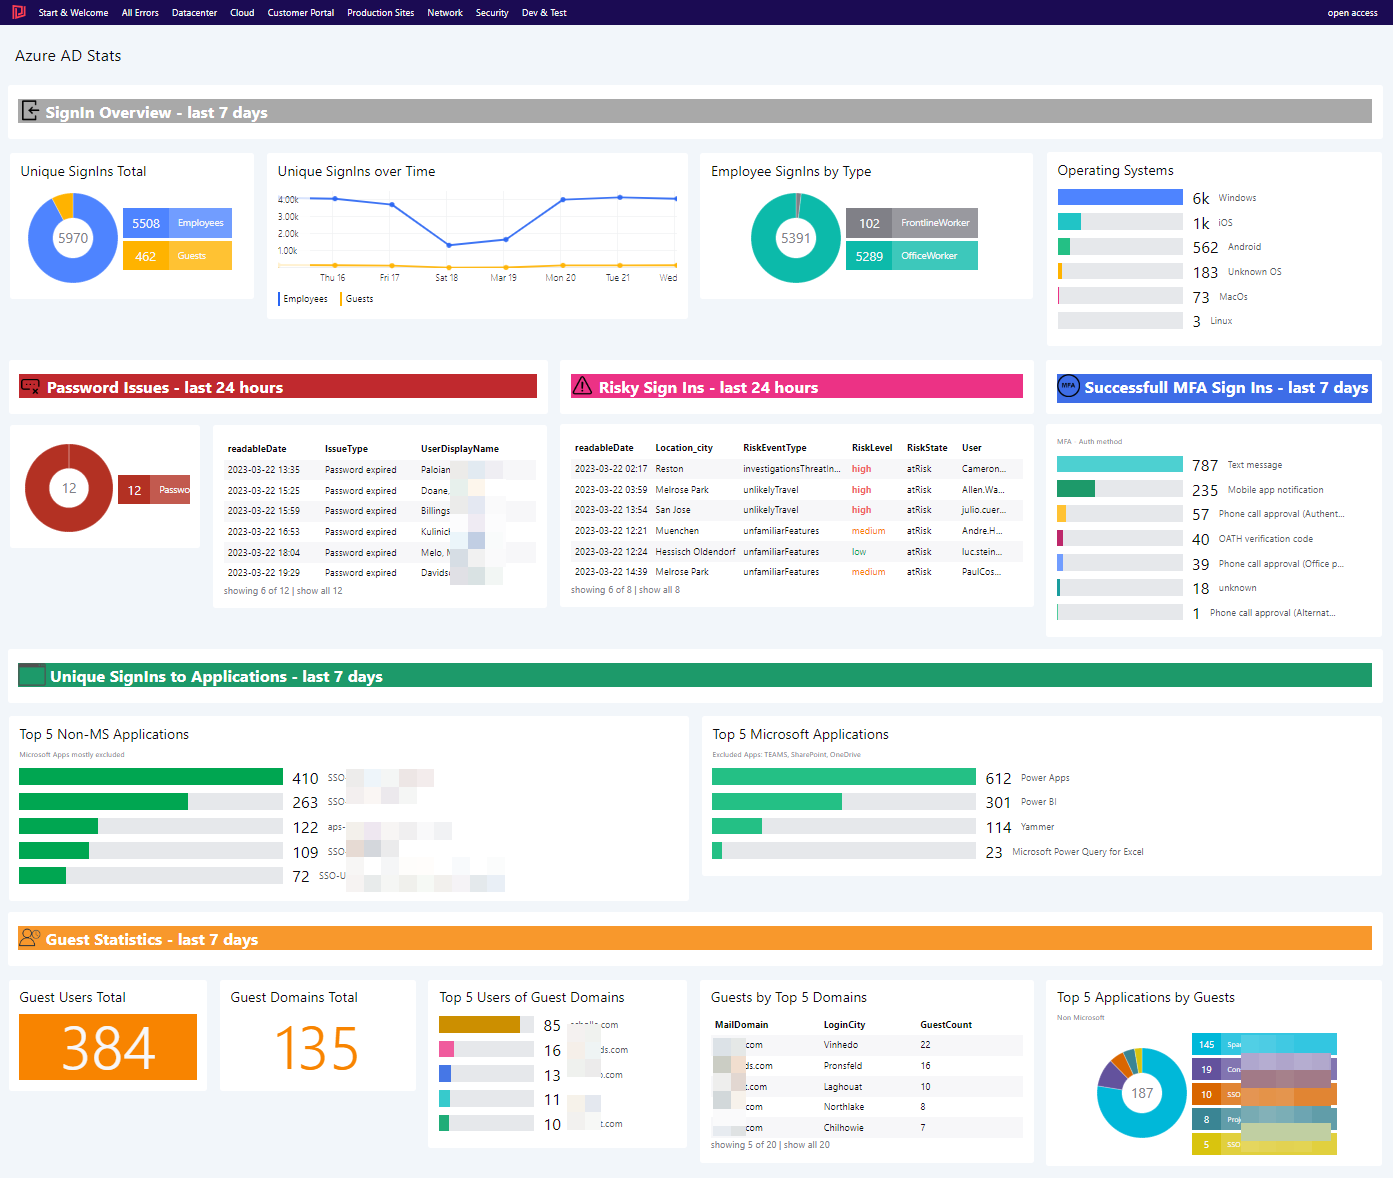
Teaser

When Azure AD is configured to record Sign-In activity, #Kusto can be used to gain valuable insights. This blog walks through common needs and shows how to visualize them in #SquaredUp.

Introduction

Having Azure AD as identity provider offers convenient Single Sign On experience for users and increased security due to MFA and other identity protection features.

Enabling auditing and storing the results in a Log Analytics Workplace allows detailed analysis about application usage, sign-in experience, user behavior and overseeing guest activity in your tenant.

Enabling-Diagnostic-Settings-for-AzureActiveDirectory

Shortly after enabling of logging, events are logged in the SigninLogs table. – Nearly all queries in this blog are against this table.

AzureAD-LogAnalytics-Table

Links about learning KQL can be found in the appendix. – Particular questions about code will be answered. – Also suggestions for better queries are appreciated! 😉

Configuration & Code

In the remaining, most of the visualizations will be explained in detail. Queries are written in #KQL and which finalizes this article.

Unique SignIns Total

This donut diagram shows the proportion of between Guests and Members ( here called Employees ) with concrete numbers. Each Guest or Member login is only count once.

Unique_SignIns_Total
SigninLogs 
| where TimeGenerated between (startofday(ago (7d)) .. now())
| where ResultType == 0
| where UserPrincipalName matches regex @"\w+@\w+\.\w+"
| extend UserLoginType = iif(UserType == "Member","Employees","Guests")
| project UserLoginType, UserPrincipalName
| summarize dcount(UserPrincipalName) by UserLoginType

Azure -Log Analytics (Donut) is the best fit here.

Unique_SignIns_Over_Time_1of2
Unique_SignIns_Over_Time_2of2

Unique Sign Ins over Time

This diagram shows Guests and Members ( here Employees ) sign in count, summarized by day. Each day counts individually.

Unique_SignIns_Over_Time
SigninLogs 
| where TimeGenerated between (startofday(ago (7d)) .. now())
| where ResultType == 0
| where UserPrincipalName matches regex @"\w+@\w+\.\w+"
| extend UserLoginType = iif(UserType == "Member","Employee","Guest")
| project TimeGenerated, UserLoginType,UserPrincipalName
| summarize Employees = dcountif(UserPrincipalName,UserLoginType=="Employee"), Guests = dcountif(UserPrincipalName,UserLoginType=="Guest") by bin(TimeGenerated, 1d)

Azure – Log Analytics (Line Graph) is the choice here.

Unique_SignIns_Over_Time_1of2
Unique_SignIns_Over_Time_2of2

Operating Systems

Used operating systems are mostly correct identified and show clearly from where Azure AD applications are consumed.

OperatingSystems
OperatingSystems
SigninLogs 
| where TimeGenerated between (startofday(ago (7d)) .. now())
| where ResultType == 0
| where UserPrincipalName matches regex @"\w+@\w+\.\w+"
| extend OSStrg = iif(isempty(tostring(DeviceDetail.operatingSystem)),"Unknown OS",tostring(DeviceDetail.operatingSystem))
| extend OSType = case (OSStrg matches regex "Windows", "Windows"
                            , OSStrg matches regex "iOS", "iOS"
                            , OSStrg matches regex "MacOs", "MacOs"
                            , OSStrg matches regex "Android", "Android"
                            , OSStrg matches regex "Linux", "Linux"
                            , "Unknown OS"
                            )

Azure – Log Analytics (Bar Graph) is picked for this visualization.

OperatingSystems_1of2
OperatingSystems_2of2

Password Issues

Users failing to login due to password issues or other are shown here. Only the last day is considered in the queries.

Password_Issues
Password_Issues

For the donut, use the following KQL query:

SigninLogs 
| where TimeGenerated between (ago(1d) .. now())
| where ResultType in(50144,50133,50126,50053)
| where UserPrincipalName matches regex @"\w+@\w+\.\w+"
| summarize arg_max(TimeGenerated, *) by UserPrincipalName
| extend IssueType = case (ResultType == 50126 , "Invalid username or bad password"
                            , ResultType == 50133, "Session invalid due to recent password change"
                            , ResultType == 50144, "Password expired"
                            , ResultType == 50133, "Account locked"
                            , "Unknown"
                            )
| where IssueType !in("Unknown","Session invalid due to recent password change","Invalid username or bad password")
| extend readableDate = format_datetime(TimeGenerated,"yyyy-MM-dd HH:mm")
| summarize Users = dcount(UserPrincipalName) by IssueType

The table overview is realized with the lines below

SigninLogs 
| where TimeGenerated between (ago(1d) .. now())
| where ResultType in(50144,50133,50126,50053)
| where UserPrincipalName matches regex @"\w+@\w+\.\w+"
| summarize arg_max(TimeGenerated, *) by UserPrincipalName
| extend IssueType = case (ResultType == 50126 , "Invalid username or bad password"
                            , ResultType == 50133, "Session invalid due to recent password change"
                            , ResultType == 50144, "Password expired"
                            , ResultType == 50133, "Account locked"
                            , "Unknown"
                            )
| where IssueType !in("Unknown","Session invalid due to recent password change","Invalid username or bad password")
| extend readableDate = format_datetime(TimeGenerated,"yyyy-MM-dd HH:mm") 
| extend Day = format_datetime(TimeGenerated,"yyyy-MM-dd") 
| extend Time = format_datetime(TimeGenerated,"HH:mm")
| summarize by IssueType, readableDate, UserDisplayName,UserID=onPremisesSamAccountName, Day, Time

Risky Sign-ins

One of Azure ADs most famous protection features is Risky Sign-Ins. An algorithm here checks for possible malicious sign in attempts that occur when credential theft occurred.

AADUserRiskEvents is the table which stores this information.

Risky_SignIns
Risky_SignIns
AADUserRiskEvents
| where TimeGenerated between (ago(1d) .. now())
| where RiskState != "dismissed"
| where RiskState != "remediated"
| extend readableDate = format_datetime(TimeGenerated,"yyyy-MM-dd HH:mm") 
| extend Day = format_datetime(TimeGenerated,"yyyy-MM-dd") 
| extend Time = format_datetime(TimeGenerated,"HH:mm") 
| summarize arg_max(TimeGenerated, *) by UserPrincipalName
| project User = replace_string(UserPrincipalName,"@mydomain.com",""), readableDate, RiskLevel, RiskEventType, RiskState, tostring(Location.city), Day, Time

Azure – Log Analytics ( grid ) is used for the  table. Conditional formatting help to spot most serious events.

Risky_SignIns_1of2
Risky_SignIns_1of2
Risky_SignIns_2of2
Risky_SignIns_2of2

MFA Successful Sign Ins

Details about usage and preference of MFA can be obtained from the Sign-In logs.

MFA-SuccessfulSignIns
SigninLogs
| where TimeGenerated between (startofday(ago(7d)) .. now())
| where ResultType == 0 and ConditionalAccessStatus == 'success' and Status.additionalDetails == "MFA completed in Azure AD" and ConditionalAccessPolicies[0].result == "success"  and parse_json(tostring(ConditionalAccessPolicies[0].enforcedGrantControls))[0] == "Mfa"
| where UserType == "Member"
| project Identity, MFAType = iif(isempty(tostring(MfaDetail.authMethod)),"unknown",tostring(MfaDetail.authMethod)) 
| summarize TotalUsers = dcount(Identity) by MFAType
| sort by TotalUsers desc

Top 5 Non-MS Applications

Usage trends of applications can be retrieved. Microsoft recently released a website which enumerates many of its applications. – Unfortunately, not all and as a static website.

See.: https://learn.microsoft.com/en-us/troubleshoot/azure/active-directory/verify-first-party-apps-sign-in

Top-5-Non-MS-Applications
let MicrosoftApps = datatable (AppName: string, AppId: string )
[
    "ACOM Azure Website","23523755-3a2b-41ca-9315-f81f3f566a95",
    "AEM-DualAuth","69893ee3-dd10-4b1c-832d-4870354be3d8",
    "ASM Campaign Servicing","0cb7b9ec-5336-483b-bc31-b15b5788de71",
    "Azure Advanced Threat Protection","7b7531ad-5926-4f2d-8a1d-38495ad33e17",
    "Azure Data Lake","e9f49c6b-5ce5-44c8-925d-015017e9f7ad",
    "Azure Lab Services Portal","835b2a73-6e10-4aa5-a979-21dfda45231c",
    "Azure Portal","c44b4083-3bb0-49c1-b47d-974e53cbdf3c",
    "AzureSupportCenter","37182072-3c9c-4f6a-a4b3-b3f91cacffce",
    "Bing","9ea1ad79-fdb6-4f9a-8bc3-2b70f96e34c7",
    "CPIM Service","bb2a2e3a-c5e7-4f0a-88e0-8e01fd3fc1f4",
    "CRM Power BI Integration","e64aa8bc-8eb4-40e2-898b-cf261a25954f",
    "Dataverse","00000007-0000-0000-c000-000000000000",
    "Enterprise Roaming and Backup","60c8bde5-3167-4f92-8fdb-059f6176dc0f",
    "IAM Supportability","a57aca87-cbc0-4f3c-8b9e-dc095fdc8978",
    "IrisSelectionFrontDoor","16aeb910-ce68-41d1-9ac3-9e1673ac9575",
    "MCAPI Authorization Prod","d73f4b35-55c9-48c7-8b10-651f6f2acb2e",
    "Media Analysis and Transformation Service","944f0bd1-117b-4b1c-af26-804ed95e767e",
    "Media Analysis and Transformation Service2","0cd196ee-71bf-4fd6-a57c-b491ffd4fb1e",  
    "O365 Suite UX","4345a7b9-9a63-4910-a426-35363201d503",    
    "Office Delve","94c63fef-13a3-47bc-8074-75af8c65887a",
    "Office Online Add-in SSO","93d53678-613d-4013-afc1-62e9e444a0a5",
    "Office Online Client AAD- Augmentation Loop","2abdc806-e091-4495-9b10-b04d93c3f040",
    "Office Online Client AAD- Loki","b23dd4db-9142-4734-867f-3577f640ad0c",
    "Office Online Client AAD- Maker","17d5e35f-655b-4fb0-8ae6-86356e9a49f5",
    "Office Online Client MSA- Loki","b6e69c34-5f1f-4c34-8cdf-7fea120b8670",
    "Office Online Core SSO","243c63a3-247d-41c5-9d83-7788c43f1c43",
    "Office Online Search","a9b49b65-0a12-430b-9540-c80b3332c127",
    "Office.com","4b233688-031c-404b-9a80-a4f3f2351f90",
    "Office365 Shell WCSS-Client","89bee1f7-5e6e-4d8a-9f3d-ecd601259da7",
    "OfficeClientService","0f698dd4-f011-4d23-a33e-b36416dcb1e6",
    "OfficeHome","4765445b-32c6-49b0-83e6-1d93765276ca",
    "OfficeShredderWacClient","4d5c2d63-cf83-4365-853c-925fd1a64357",
    "OMSOctopiPROD","62256cef-54c0-4cb4-bcac-4c67989bdc40",
    "OneDrive SyncEngine","ab9b8c07-8f02-4f72-87fa-80105867a763",
    "OneNote","2d4d3d8e-2be3-4bef-9f87-7875a61c29de",
    "Outlook Mobile","27922004-5251-4030-b22d-91ecd9a37ea4",
    "Partner Customer Delegated Admin Offline Processor","a3475900-ccec-4a69-98f5-a65cd5dc5306",
    "Password Breach Authenticator","bdd48c81-3a58-4ea9-849c-ebea7f6b6360",
    "Power BI Service","00000009-0000-0000-c000-000000000000",
    "SharedWithMe","ffcb16e8-f789-467c-8ce9-f826a080d987",
    "SharePoint Online Web Client Extensibility","08e18876-6177-487e-b8b5-cf950c1e598c",
    "Signup","b4bddae8-ab25-483e-8670-df09b9f1d0ea",
    "Skype for Business Online","00000004-0000-0ff1-ce00-000000000000",
    "Sway","905fcf26-4eb7-48a0-9ff0-8dcc7194b5ba",
    "Universal Store Native Client","268761a2-03f3-40df-8a8b-c3db24145b6b",
    "Vortex [wsfed enabled]","5572c4c0-d078-44ce-b81c-6cbf8d3ed39e",    
    "Yammer","00000005-0000-0ff1-ce00-000000000000",
    "Yammer Web","c1c74fed-04c9-4704-80dc-9f79a2e515cb",
    "Yammer Web Embed","e1ef36fd-b883-4dbf-97f0-9ece4b576fc6",
    "Windows Sign In","38aa3b87-a06d-4817-b275-7a316988d93b",
    "PowerApps - apps.powerapps.com","3e62f81e-590b-425b-9531-cad6683656cf",
    "make.powerapps.com","a8f7a65c-f5ba-4859-b2d6-df772c264e9d",
    "Microsoft Azure Information Protection","c00e9d32-3c8d-4a7d-832b-029040e7db99",
    "Microsoft Edge Enterprise New Tab Page","d7b530a4-7680-4c23-a8bf-c52c121d2e87",    
    "Microsoft Account Controls V2","7eadcef8-456d-4611-9480-4fff72b8b9e2",
    "SharePoint Online Client Extensibility Web Application Principal","f7f708bc-b136-4073-b000-e730786c986e",    
    "Power BI Desktop","7f67af8a-fedc-4b08-8b4e-37c4d127b6cf",    
    "Office Online Print SSO","3ce44149-e365-40e4-9bb4-8c0ecb710fe6",
    "PowerApps","4e291c71-d680-4d0e-9640-0a3358e31177",
    "My Profile","8c59ead7-d703-4a27-9e55-c96a0054c8d2",
    "Apple Internet Accounts","f8d98a96-0999-43f5-8af3-69971c7bb423",
    "My Signins","19db86c3-b2b9-44cc-b339-36da233a3be2",
    "My Apps","2793995e-0a7d-40d7-bd35-6968ba142197"    
];
let MicrosoftAppIdList = MicrosoftApps | summarize MicrosoftAppIds = make_list(AppId);
let AllMembers = materialize(SigninLogs 
| where TimeGenerated between (startofday(ago (7d)) .. now())
| where ResultType == 0
| where UserType == "Member"
| where UserPrincipalName matches regex @"\w+@\w+\.\w+");
AllMembers
| project TimeGenerated, Location, AppDisplayName, LoginCity=tostring(LocationDetails.city), UserPrincipalName, OSType = tostring(DeviceDetail.operatingSystem), AppId, UserType
| where tostring(AppId) !in (MicrosoftAppIdList)
| where AppDisplayName !startswith("Microsoft")
| where AppDisplayName !startswith("Office")
| where AppDisplayName !startswith("Windows")
| summarize UserCount = dcount(UserPrincipalName) by AppDisplayName
| sort by UserCount desc
| top 5 by UserCount

Top 5 MS Applications (OneDrive, Teams, SharePoint excluded)

This query focusses on Microsoft Applications. As every user uses OneDrive, SharePoint and Teams those are excluded.

Top-5-MS-Applications
let MicrosoftApps = datatable (AppName: string, AppId: string )
[
    "ACOM Azure Website","23523755-3a2b-41ca-9315-f81f3f566a95",
    "AEM-DualAuth","69893ee3-dd10-4b1c-832d-4870354be3d8",
    "ASM Campaign Servicing","0cb7b9ec-5336-483b-bc31-b15b5788de71",
    "Azure Advanced Threat Protection","7b7531ad-5926-4f2d-8a1d-38495ad33e17",
    "Azure Data Lake","e9f49c6b-5ce5-44c8-925d-015017e9f7ad",
    "Azure Lab Services Portal","835b2a73-6e10-4aa5-a979-21dfda45231c",
    "Azure Portal","c44b4083-3bb0-49c1-b47d-974e53cbdf3c",
    "AzureSupportCenter","37182072-3c9c-4f6a-a4b3-b3f91cacffce",
    "Bing","9ea1ad79-fdb6-4f9a-8bc3-2b70f96e34c7",
    "CPIM Service","bb2a2e3a-c5e7-4f0a-88e0-8e01fd3fc1f4",
    "CRM Power BI Integration","e64aa8bc-8eb4-40e2-898b-cf261a25954f",
    "Dataverse","00000007-0000-0000-c000-000000000000",
    "Enterprise Roaming and Backup","60c8bde5-3167-4f92-8fdb-059f6176dc0f",
    "IAM Supportability","a57aca87-cbc0-4f3c-8b9e-dc095fdc8978",
    "IrisSelectionFrontDoor","16aeb910-ce68-41d1-9ac3-9e1673ac9575",
    "MCAPI Authorization Prod","d73f4b35-55c9-48c7-8b10-651f6f2acb2e",
    "Media Analysis and Transformation Service","944f0bd1-117b-4b1c-af26-804ed95e767e",
    "Media Analysis and Transformation Service2","0cd196ee-71bf-4fd6-a57c-b491ffd4fb1e",  
    "O365 Suite UX","4345a7b9-9a63-4910-a426-35363201d503",    
    "Office Delve","94c63fef-13a3-47bc-8074-75af8c65887a",
    "Office Online Add-in SSO","93d53678-613d-4013-afc1-62e9e444a0a5",
    "Office Online Client AAD- Augmentation Loop","2abdc806-e091-4495-9b10-b04d93c3f040",
    "Office Online Client AAD- Loki","b23dd4db-9142-4734-867f-3577f640ad0c",
    "Office Online Client AAD- Maker","17d5e35f-655b-4fb0-8ae6-86356e9a49f5",
    "Office Online Client MSA- Loki","b6e69c34-5f1f-4c34-8cdf-7fea120b8670",
    "Office Online Core SSO","243c63a3-247d-41c5-9d83-7788c43f1c43",
    "Office Online Search","a9b49b65-0a12-430b-9540-c80b3332c127",
    "Office.com","4b233688-031c-404b-9a80-a4f3f2351f90",
    "Office365 Shell WCSS-Client","89bee1f7-5e6e-4d8a-9f3d-ecd601259da7",
    "OfficeClientService","0f698dd4-f011-4d23-a33e-b36416dcb1e6",
    "OfficeHome","4765445b-32c6-49b0-83e6-1d93765276ca",
    "OfficeShredderWacClient","4d5c2d63-cf83-4365-853c-925fd1a64357",
    "OMSOctopiPROD","62256cef-54c0-4cb4-bcac-4c67989bdc40",
    "OneDrive SyncEngine","ab9b8c07-8f02-4f72-87fa-80105867a763",
    "OneNote","2d4d3d8e-2be3-4bef-9f87-7875a61c29de",
    "Outlook Mobile","27922004-5251-4030-b22d-91ecd9a37ea4",
    "Partner Customer Delegated Admin Offline Processor","a3475900-ccec-4a69-98f5-a65cd5dc5306",
    "Password Breach Authenticator","bdd48c81-3a58-4ea9-849c-ebea7f6b6360",    
    "SharedWithMe","ffcb16e8-f789-467c-8ce9-f826a080d987",
    "SharePoint Online Web Client Extensibility","08e18876-6177-487e-b8b5-cf950c1e598c",
    "Signup","b4bddae8-ab25-483e-8670-df09b9f1d0ea",
    "Skype for Business Online","00000004-0000-0ff1-ce00-000000000000",
    "Sway","905fcf26-4eb7-48a0-9ff0-8dcc7194b5ba",
    "Universal Store Native Client","268761a2-03f3-40df-8a8b-c3db24145b6b",
    "Vortex [wsfed enabled]","5572c4c0-d078-44ce-b81c-6cbf8d3ed39e",        
    "Windows Sign In","38aa3b87-a06d-4817-b275-7a316988d93b",        
    "Microsoft Edge Enterprise New Tab Page","d7b530a4-7680-4c23-a8bf-c52c121d2e87",    
    "Microsoft Account Controls V2","7eadcef8-456d-4611-9480-4fff72b8b9e2",
    "SharePoint Online Client Extensibility Web Application Principal","f7f708bc-b136-4073-b000-e730786c986e",        
    "Office Online Print SSO","3ce44149-e365-40e4-9bb4-8c0ecb710fe6",    
    "My Profile","8c59ead7-d703-4a27-9e55-c96a0054c8d2",
    "Apple Internet Accounts","f8d98a96-0999-43f5-8af3-69971c7bb423",
    "My Signins","19db86c3-b2b9-44cc-b339-36da233a3be2",
    "My Apps","2793995e-0a7d-40d7-bd35-6968ba142197"    
];
let MicrosoftAppIdList = MicrosoftApps | summarize MicrosoftAppIds = make_list(AppId);
let AllMembers = materialize(SigninLogs 
| where TimeGenerated between (startofday(ago (7d)) .. now())
| where ResultType == 0
| where UserType == "Member"
| where UserPrincipalName matches regex @"\w+@\w+\.\w+");
AllMembers
| project TimeGenerated, Location, AppDisplayName, LoginCity=tostring(LocationDetails.city), UserPrincipalName, OSType = tostring(DeviceDetail.operatingSystem), AppId, UserType
| where tostring(AppId) !in (MicrosoftAppIdList)
| where AppDisplayName matches regex "(?i)Power|make|yammer|dataverse"
| where AppDisplayName !contains("PowerShell")
| extend AppType = case (AppId in("3e62f81e-590b-425b-9531-cad6683656cf", "a8f7a65c-f5ba-4859-b2d6-df772c264e9d", "4e291c71-d680-4d0e-9640-0a3358e31177","065d9450-1e87-434e-ac2f-69af271549ed"), "Power Apps"
                            , AppDisplayName matches regex "Power BI|PowerBI" , "Power BI"
                            , AppDisplayName has "Yammer", "Yammer"                            
                            , AppDisplayName
                            )
| summarize UserCount = dcount(UserPrincipalName) by  AppType
| top 10 by UserCount
| sort by UserCount desc

Guest Users Total

Enumerates the total number of individual Guest accounts who signed in.

Guets_users_Total
Guets_users_Total
SigninLogs 
| where TimeGenerated between (startofday(ago (7d)) .. now())
| where ResultType == 0
| where UserPrincipalName matches regex @"\w+@\w+\.\w+"
| where UserType == "Guest"
| project TimeGenerated, UserPrincipalName
| summarize DomainCount = dcount(UserPrincipalName)
Guets_users_Total_1of2
Guets_users_Total_2of2

Guest Domains Total

This queries groups guests by their domain name and counts them then as Guest-Domain.

Guest_Domains_Total
Guest_Domains_Total
SigninLogs 
| where TimeGenerated between (startofday(ago (7d)) .. now())
| where ResultType == 0
| where UserPrincipalName matches regex @"\w+@\w+\.\w+"
| where UserType == "Guest"
| project TimeGenerated, UserPrincipalName
| extend MailDomain = replace_string(extract("@\\S+$",0,UserPrincipalName),"@","")
| summarize DomainCount = dcount(MailDomain)

Top 5 Users of Guest Domains

Shows which Domains of Guest users show up most.

Top-5-Guest-User-Domains
SigninLogs 
| where TimeGenerated between (startofday(ago (7d)) .. now())
| where ResultType == 0
| where UserPrincipalName matches regex @"\w+@\w+\.\w+"
| where UserPrincipalName !endswith("mydomain.com")
| where UserType == "Guest"
| project TimeGenerated, AppDisplayName, UserPrincipalName
| extend MailDomain = replace_string(extract("@\\S+$",0,UserPrincipalName),"@","")
| summarize GuestCount = dcount(UserPrincipalName) by MailDomain
| top 5 by GuestCount

Top 5 Applications by Guests

This identifies which applications are used most by guests. Most popular Microsoft Applications are excluded.

Top-5-Apps-By-Guests
let MicrosoftApps = datatable (AppName: string, AppId: string )
[
    "ACOM Azure Website","23523755-3a2b-41ca-9315-f81f3f566a95",
    "AEM-DualAuth","69893ee3-dd10-4b1c-832d-4870354be3d8",
    "ASM Campaign Servicing","0cb7b9ec-5336-483b-bc31-b15b5788de71",
    "Azure Advanced Threat Protection","7b7531ad-5926-4f2d-8a1d-38495ad33e17",
    "Azure Data Lake","e9f49c6b-5ce5-44c8-925d-015017e9f7ad",
    "Azure Lab Services Portal","835b2a73-6e10-4aa5-a979-21dfda45231c",
    "Azure Portal","c44b4083-3bb0-49c1-b47d-974e53cbdf3c",
    "AzureSupportCenter","37182072-3c9c-4f6a-a4b3-b3f91cacffce",
    "Bing","9ea1ad79-fdb6-4f9a-8bc3-2b70f96e34c7",
    "CPIM Service","bb2a2e3a-c5e7-4f0a-88e0-8e01fd3fc1f4",
    "CRM Power BI Integration","e64aa8bc-8eb4-40e2-898b-cf261a25954f",
    "Dataverse","00000007-0000-0000-c000-000000000000",
    "Enterprise Roaming and Backup","60c8bde5-3167-4f92-8fdb-059f6176dc0f",
    "IAM Supportability","a57aca87-cbc0-4f3c-8b9e-dc095fdc8978",
    "IrisSelectionFrontDoor","16aeb910-ce68-41d1-9ac3-9e1673ac9575",
    "MCAPI Authorization Prod","d73f4b35-55c9-48c7-8b10-651f6f2acb2e",
    "Media Analysis and Transformation Service","944f0bd1-117b-4b1c-af26-804ed95e767e",
    "Media Analysis and Transformation Service2","0cd196ee-71bf-4fd6-a57c-b491ffd4fb1e",  
    "O365 Suite UX","4345a7b9-9a63-4910-a426-35363201d503",    
    "Office Delve","94c63fef-13a3-47bc-8074-75af8c65887a",
    "Office Online Add-in SSO","93d53678-613d-4013-afc1-62e9e444a0a5",
    "Office Online Client AAD- Augmentation Loop","2abdc806-e091-4495-9b10-b04d93c3f040",
    "Office Online Client AAD- Loki","b23dd4db-9142-4734-867f-3577f640ad0c",
    "Office Online Client AAD- Maker","17d5e35f-655b-4fb0-8ae6-86356e9a49f5",
    "Office Online Client MSA- Loki","b6e69c34-5f1f-4c34-8cdf-7fea120b8670",
    "Office Online Core SSO","243c63a3-247d-41c5-9d83-7788c43f1c43",
    "Office Online Search","a9b49b65-0a12-430b-9540-c80b3332c127",
    "Office.com","4b233688-031c-404b-9a80-a4f3f2351f90",
    "Office365 Shell WCSS-Client","89bee1f7-5e6e-4d8a-9f3d-ecd601259da7",
    "OfficeClientService","0f698dd4-f011-4d23-a33e-b36416dcb1e6",
    "OfficeHome","4765445b-32c6-49b0-83e6-1d93765276ca",
    "OfficeShredderWacClient","4d5c2d63-cf83-4365-853c-925fd1a64357",
    "OMSOctopiPROD","62256cef-54c0-4cb4-bcac-4c67989bdc40",
    "OneDrive SyncEngine","ab9b8c07-8f02-4f72-87fa-80105867a763",
    "OneNote","2d4d3d8e-2be3-4bef-9f87-7875a61c29de",
    "Outlook Mobile","27922004-5251-4030-b22d-91ecd9a37ea4",
    "Partner Customer Delegated Admin Offline Processor","a3475900-ccec-4a69-98f5-a65cd5dc5306",
    "Password Breach Authenticator","bdd48c81-3a58-4ea9-849c-ebea7f6b6360",
    "Power BI Service","00000009-0000-0000-c000-000000000000",
    "SharedWithMe","ffcb16e8-f789-467c-8ce9-f826a080d987",
    "SharePoint Online Web Client Extensibility","08e18876-6177-487e-b8b5-cf950c1e598c",
    "Signup","b4bddae8-ab25-483e-8670-df09b9f1d0ea",
    "Skype for Business Online","00000004-0000-0ff1-ce00-000000000000",
    "Sway","905fcf26-4eb7-48a0-9ff0-8dcc7194b5ba",
    "Universal Store Native Client","268761a2-03f3-40df-8a8b-c3db24145b6b",
    "Vortex [wsfed enabled]","5572c4c0-d078-44ce-b81c-6cbf8d3ed39e",    
    "Yammer","00000005-0000-0ff1-ce00-000000000000",
    "Yammer Web","c1c74fed-04c9-4704-80dc-9f79a2e515cb",
    "Yammer Web Embed","e1ef36fd-b883-4dbf-97f0-9ece4b576fc6",
    "Windows Sign In","38aa3b87-a06d-4817-b275-7a316988d93b",
    "PowerApps - apps.powerapps.com","3e62f81e-590b-425b-9531-cad6683656cf",
    "make.powerapps.com","a8f7a65c-f5ba-4859-b2d6-df772c264e9d",
    "Microsoft Azure Information Protection","c00e9d32-3c8d-4a7d-832b-029040e7db99",
    "Microsoft Edge Enterprise New Tab Page","d7b530a4-7680-4c23-a8bf-c52c121d2e87",    
    "Microsoft Account Controls V2","7eadcef8-456d-4611-9480-4fff72b8b9e2",
    "SharePoint Online Client Extensibility Web Application Principal","f7f708bc-b136-4073-b000-e730786c986e",    
    "Power BI Desktop","7f67af8a-fedc-4b08-8b4e-37c4d127b6cf",    
    "Office Online Print SSO","3ce44149-e365-40e4-9bb4-8c0ecb710fe6",
    "PowerApps","4e291c71-d680-4d0e-9640-0a3358e31177",
    "My Profile","8c59ead7-d703-4a27-9e55-c96a0054c8d2",
    "Apple Internet Accounts","f8d98a96-0999-43f5-8af3-69971c7bb423",
    "My Signins","19db86c3-b2b9-44cc-b339-36da233a3be2",
    "My Apps","2793995e-0a7d-40d7-bd35-6968ba142197"    
];
let MicrosoftAppIdList = MicrosoftApps | summarize MicrosoftAppIds = make_list(AppId);
let AllMembers = materialize(SigninLogs 
| where TimeGenerated between (startofday(ago (7d)) .. now())
| where ResultType == 0
| where UserPrincipalName matches regex @"\w+@\w+\.\w+"
| where UserType == "Guest");
AllMembers
| project TimeGenerated, Location, AppDisplayName, UserPrincipalName, AppId
| where tostring(AppId) !in (MicrosoftAppIdList)
| where AppDisplayName !startswith("Microsoft")
| where AppDisplayName !startswith("Office")
| where AppDisplayName !startswith("Windows")
| summarize UserCount = dcount(UserPrincipalName) by AppDisplayName
| top 5 by UserCount
| sort by UserCount desc

Conclusion

These queries demonstrate the power of #KQL. In combination with SquaredUp-Dashboards your Azure AD utilization can be well explained.

Appendix

KQL is a very interesting query language. Best training resources in my opinion are: https://www.pluralsight.com/courses/kusto-query-language-kql-from-scratch

https://www.pluralsight.com/courses/microsoft-azure-data-explorer-starting

#SquaredUp the tool which is used for Visualization can be found on: https://ds.squaredup.com/

Visualize Aruba Wireless Infrastructure with Squared Up

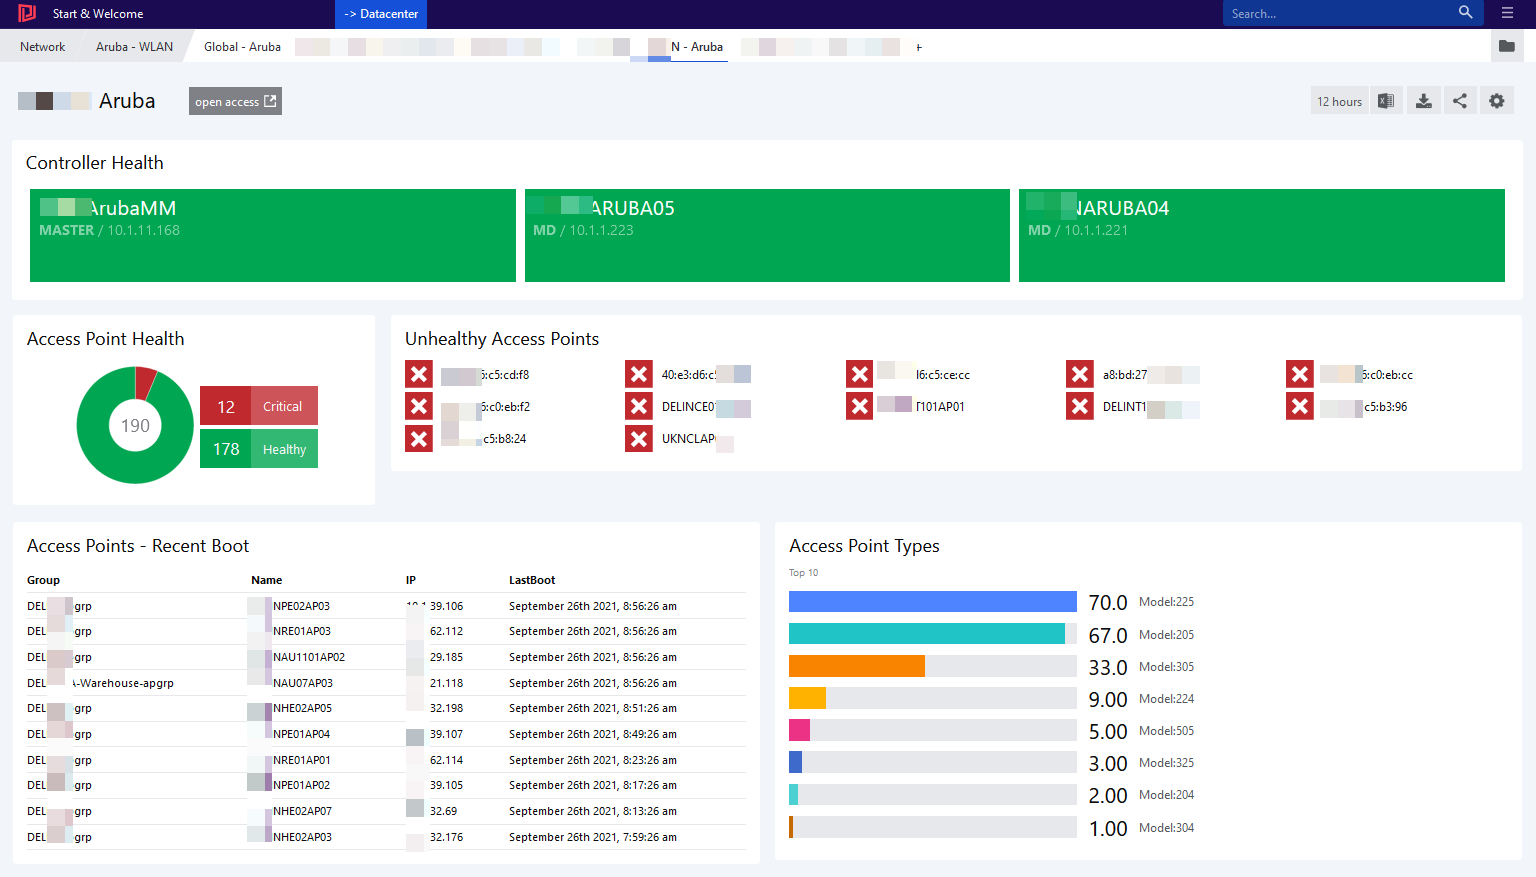
Aruba Wireless technology is one of the market leaders. Squared Up can bring in visibility and reduces the MTTR*.

This post explains by example how to extract, transform, and visualize Aruba data by using the PowerShell and Squared Up.

Introduction

Aruba (part of HP Enterprise) provides wireless LAN solutions for small offices to large enterprise networks. Mobility-controller are used to manage access points centrally. By using master-controller a management hierarchy can be setup by keeping one point of administration.

Network specialists either use command line or the web interface. Automation and programmatic access are given via common REST API.

Squared Up in version 5.3 (Jan 2022) offers many possibilities to retrieve data and visualize it in no time.

Most versatile capability is the native integration of PowerShell. It allows any kind of data transformation or aggregation before passing it the dashboard engine.

Prerequisites

At least Aruba OS 8.5 on the controller and PowerShell 5.1 on the Squared Up server are suggested.

A local user account “aruba_monitor” with password needs to be created on the controller.

Dry Run

Before coming to the details, try if retrieving Aruba information from the Squared Up server works.

Getting all switches:

The script below retrieves all switches ( controller ) and adds state information that is needed for Squared Up. The information is stored in a CSV file which allows instant showing of the information. Use Scheduled Tasks to run the script regularly (e.g. every 5 minutes).

#region PREWORK Disabling the certificate validations
add-type -TypeDefinition @"
    using System.Net;
    using System.Security.Cryptography.X509Certificates;
    public class TrustAllCertsPolicy : ICertificatePolicy {
        public bool CheckValidationResult(
            ServicePoint srvPoint, X509Certificate certificate,
            WebRequest request, int certificateProblem) {
            return true;
        }
    }
"@
[Net.ServicePointManager]::CertificatePolicy = New-Object -TypeName TrustAllCertsPolicy
#endregion PREWORK


$API_BASE_URI    = 'https://your-aruba-master-url'
$DeviceUsername  = 'aruba_monitor'
$DevicePassword  = 'your-password'


$session = Invoke-RestMethod -Uri "${API_BASE_URI}/v1/api/login" -Method Post -Body "username=$DeviceUsername&password=$DevicePassword" -SessionVariable api_session

$sessionID = $session._global_result.UIDARUBA
 

$allSwitches =  Invoke-RestMethod -Uri "${API_BASE_URI}/v1/configuration/showcommand?command=show+switches+all&UIDARUBA=${sessionID}" -WebSession $api_session
$switches = $allSwitches.'All Switches'


$switchList = New-Object -TypeName System.Collections.ArrayList

foreach ($sw in $switches) {

  $stateTmp = ($sw.Status -split ' ')[0]
  $state = 'Healthy'
  if ($stateTmp -ieq 'up') {
    $state = 'Healthy'
  } elseif ($stateTmp -ieq 'down') {
    $state = 'Critical'
  } else {
    $state = 'Warning'
  }

  $swObj = [pscustomobject]@{
    ConfigID           = $sw.'Config ID'
    ConfigSyncTimeSec  = $sw.'Config Sync Time (sec)'
    ConfigurationState = $sw.'Configuration State'
    name               = $sw.Name
    IP                 = $sw.'IP Address'
    Status             = $stateTmp
    Location           = $sw.Location
    Model              = $sw.Model
    SiteCode           = $sw.Name.Substring(0,5).ToUpper()
    Type               = $sw.Type
    State              = $state
  }

  $null = $switchList.Add($swObj)


} #end foreach ($sw in $switches) 


$switchList | Export-Csv -NoTypeInformation -Path C:\temp\aruba_switchlist.csv -Force


#log off – Important as otherwise all sessions will be blocked!
Invoke-RestMethod -Uri "${API_BASE_URI}/v1/api/logout" -Method Post -SessionVariable api_session 

Getting all access points:

For convenience, simply extend the script above ( just before log off section ) the following lines which export all access points. – Some meta information is appended, too:

$allAccessPoints = Invoke-RestMethod -Uri "${API_BASE_URI}/v1/configuration/showcommand?command=show+ap+database&UIDARUBA=${sessionID}" -WebSession $api_session
$accessPoints = $allAccessPoints.'AP Database'


$accessPointList = New-Object -TypeName System.Collections.ArrayList


foreach ($ap in $accessPoints) {

  $switchName = $switches | Where-Object {$_.'IP Address' -eq $ap.'Switch IP'} | Select-Object -ExpandProperty Name
  $siteCode = $switchName.Substring(0,5).ToUpper()

  if ($ap.Status.Length -gt 6) {
    $uptime = ($ap.Status -split ' ')[1]
    $tmpTime = $uptime -replace '[a-z]',''
    $tmpTime2 = $tmpTime -split ':'
    $tmpTime3 = New-TimeSpan -Days $tmpTime2[0] -Hours $tmpTime2[1] -Minutes $tmpTime2[2]
    $lastboot = (Get-Date) - [timespan]$tmpTime3
  } else {
    $uptime = 0 
    $lastboot = 0
  }

  $stateTmp = ($ap.Status -split ' ')[0]
  $state = 'Healthy'
  if ($stateTmp -ieq 'up') {
    $state = 'Healthy'
  } elseif ($stateTmp -ieq 'down') {
    $state = 'Critical'
  } else {
    $state = 'Warning'
  }


  $apObj = [pscustomobject]@{
    apType     = "Model:" + $ap.'AP Type'
    Flags      = $ap.Flags
    Group      = $ap.Group
    Name       = $ap.Name
    IP         = $ap.'IP Address'
    Status     = $stateTmp
    UpTime     = $uptime
    LastBoot   = $lastboot
    SwIP       = $ap.'Switch IP'
    SiteCode   = $siteCode
    SwitchName = $switchName
    State      = $state
  }

  $null = $accessPointList.Add($apObj)

} # end foreach ($ap in $accessPoints)


$accessPointList  | Export-Csv -NoTypeInformation -Path C:\temp\aruba_accesspointlist.csv -Force

Verifying results

Running the scripts should result in having two CSV files in C:\Temp. If this is the case, proceed.

E.g. aruba_switchlist.csv

"ConfigID","ConfigSyncTimeSec","ConfigurationState","name","IP","Status","Location","Model","SiteCode","Type","State"
"1872","0","UPDATE SUCCESSFUL","ArubaMM","10.1.11.168","up","Building1.floor1","ArubaMM-VA","DEL","master","Healthy"
"1872","10","UPDATE SUCCESSFUL","ARUBA02","172.16.2.240","up","Building1.floor1","Aruba7030","ATS","MD","Healthy"

E.g. aruba_accesspointlist.csv

"apType","Flags","Group","Name","IP","Status","UpTime","LastBoot","SwIP","SiteCode","SwitchName","State"
"Model:224","U2","default","40:e3:d6:c5:cd:f8","10.1.21.104","Down","0","0","10.1.1.221","DELIN","DELINARUBA04","Critical"
"Model:515","2","AEDUB-apgrp","AEDUBAP02","172.31.20.21","Up","9d:4h:22m:2s","2/3/2022 11:11:24 AM","172.31.2.90","AEDUB","AEDUBARUBA01","Healthy"

Overview Dashboard

Create the overview dashboard that is shown at the beginning. Create a new dashboard.

Section: Controller Health

Start with PowerShell (Status – Block):

Enter the script and apply filtering in needed:

Finalize by adding a sub label:

Section: Access Points Health

Start with PowerShell (Donut):

Enter the script and apply filter is required:

Apply custom color formatting:

Section: Unhealthy Access Points

Start with PowerShell (Status -Icons)

Enter the script and filter if needed:

Pick the proper label:

Section: Access Points – Recent Boots

Start with PowerShell (Grid):

Enter the script:

Configure the grid columns:

Section: Access Points Types

Start with PowerShell (bar graph):

Enter the script and filter if needed:

Set the label property:

Enable multiple colors:

Conclusion

This example has shown you how to easily create a dashboard of your Aruba infrastructure.

Btw: Squared Up Community Edition is free! – Find it on: https://squaredup.com/community-edition/

One more thing …

Another great use case is using the PowerShell (Status Icon) tile in combination with your building layout. – See your access points health and know exactly where they are:

* MTTR = Mean Time To Repair

Monitor O365 with SCOM 4 (4 of 4)

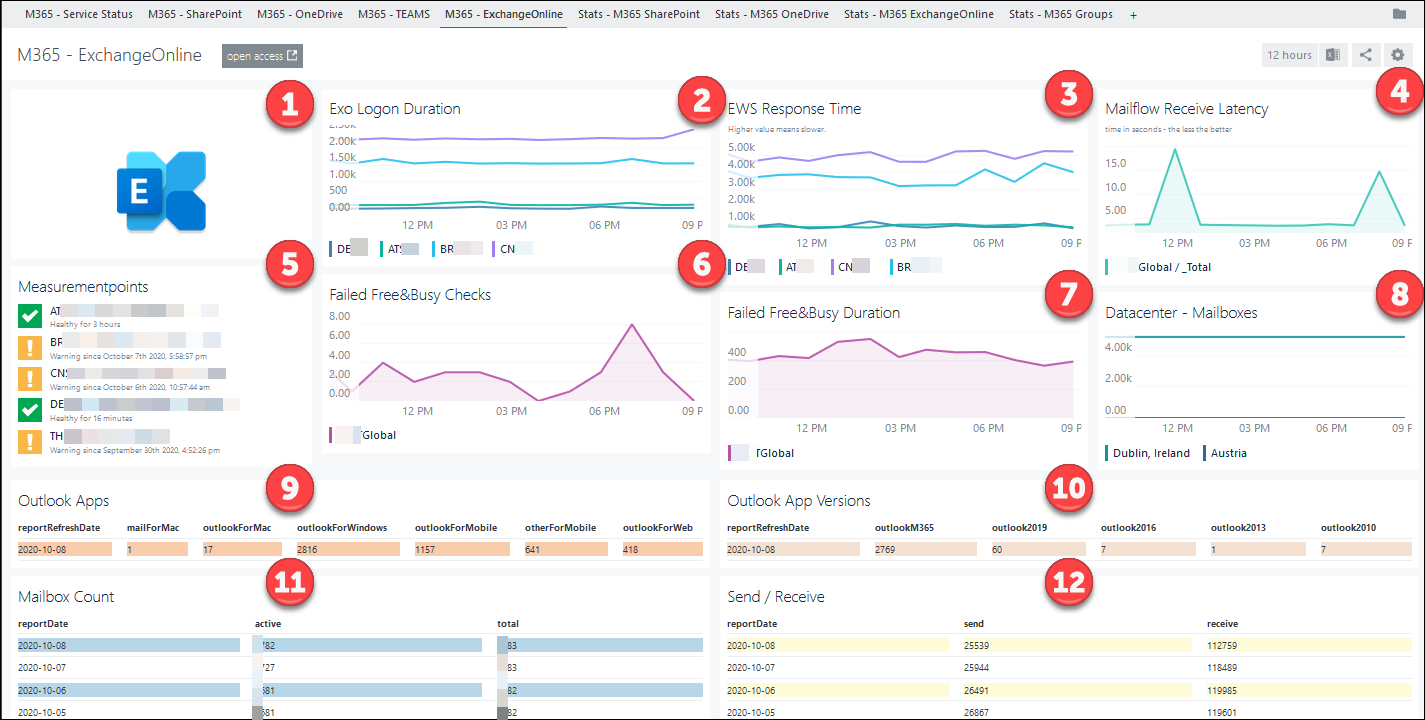
Combining SCOM, NiCE’ Active 365 MP and SquaredUp helps to bring light into your M365 tenant.

O365 Cockpit – SCOM+NiCE+Squared Up

The remaining section shines in the light of Governance. It provides a few dashboard ideas and explains used components in detail.

M365 – Service Status

Consolidates various aspects about service health, incidents and consumption.

(1) The top section shows health state about all services used in your tenant including the last update time.
(2) In the middle information about current incidents are shown.

Both leverages the Office 365 Management API


(3) on the foot left active user count vs. services are shown
(4) least, at the left corner license consumption details are displayed

Both tiles at bottom leverage GRAPH API requests.

Alternating colors require the Data On Demand Addendum – Management Pack for Windows Computers which is available through the free Management Pack catalog

Squared Up – Tile details:

ParameterValue
ClientIdYour client ID
ClientSecretYour client Secret
TenantIdYour tenant ID
SCOM-TaskGet-MSO365MgmtData
GraphQry/ServiceComms/CurrentStatus
DisplayItemNumber30
FilteredBy$_.Workload -ine ’Bookings’
SortedByStatus
(1) Services
ParameterValue
ClientIdYour client ID
ClientSecretYour client Secret
TenantIdYour tenant ID
TaskGet-MSO365MgmtData
GraphQry/ServiceComms/Messages
DisplayItemNumber30
FilteredBy$_.MessageType -ieq ‘incident’ -and (-not $_.EndTime)
SortedByStartTime
(2) Incidents
ParameterValue
ClientIdYour client ID
ClientSecretYour client Secret
TenantIdYour tenant ID
TaskGet-MSGraphBetaData
GraphQry/reports/getOffice365ActiveUserCounts(period=‘D7‘)?$format=application/json
SortedByreportDate
SortDescendingtrue
Active User Counts
ParameterValue
ClientIdYour client ID
ClientSecretYour client Secret
TenantIdYour tenant ID
TaskGet-MSGraphBetaData
GraphQry/subscribedSkus
DisplayItemNumber20
FilteredBy$_skuePartNumber -ine ‘MCOEV’ …
SortedByconsumedUnits
SortDescendingtrue
Licenses

M365 – SharePoint Online

Combines SharePoint Online availability and performance aspects measured from different proxy locations with details about recent most frequently visited and highest storage consumption.

Squared Up – Tile details:

(1) SharePoint Online logo
Web Tile / HTML /

<center> <img src="https://squaredup.ourdomain.abc/CustomPicturesForSquaredUp/SharePoint.png" height=240 width=240 valign=top> </center> 

(2) Reachability
Status / Icons / Scope: Class NiCE Active 365 SharePoint Probe Location

(3) Logon Duration
Performance / Line Graph / Scope: Class NiCE Active 365 SharePoint Probe Location / Metric SharePointOnline – LogOn Duration (Web)

(4) SharePoint Health Score
Performance / Line Graph / Scope: Class NiCE Active 365 SharePoint Online / Metric (SharePointOnline – Upload File (Web) (( display name bug ))

(5) Download File
Performance / Line Graph / Scope: Class NiCE Active 365 SharePoint Probe Location / Metric SharePointOnline – Download File (Web)

(6) Upload File
Performance / Line Graph / Scope: Class NiCE Active 365 SharePoint Probe Location / Metric SharePointOnline – Upload File (Web)

ParameterValue
ClientIdYour client ID
ClientSecretYour client Secret
TenantIdYour tenant ID
TaskGet-MSGraphBetaData
GraphQry/reports/getSharePointSiteUsageDetail(period=’D7′)?`$format=application/json&amp;`$select=siteUrl,isDeleted,pageViewCount,lastActivityDate,storageUsedInBytes,storageAllocatedInBytes,visitedPageCount,&`$top=5000
DisplayItemNumber6
FilteredBy$_.isDeleted -ne $True -and $_.siteUrl -notMatch ‘yourTenantName-my’ -and $_.siteUrl -ine ‘https://yourTenantName.sharepoint.com/’
SortedBypageViewCount
SortDescendingTrue
(7) Site Page View Count
ParameterValue
ClientIdYour client ID
ClientSecretYour client Secret
TenantIdYour tenant ID
TaskGet-MSGraphBetaData
GraphQry/reports/getSharePointSiteUsageDetail(period=’D7′)?`$format=application/json&amp;`$select=siteUrl,isDeleted,lastActivityDate,storageUsedInBytes,storageAllocatedInBytes,visitedPageCount,&amp;`$top=5000
DisplayItemNumber6
FilteredBy$_.isDeleted -ne $True
SortedBystorageUsedInBytes
SortDescendingtrue
(8) Site Storage Used

(9) Online Storage Growth
Performance / Line Graph / Scope: Class NiCE Active 365 SharePoint Online / Metric SharePointOnline – SpO Storage Size / TimeFrame: 3 Months

(10) Online Storage Size
Performance / Scalar / Scope Class NiCE Active 365 SharePoint Online / Metric SharePointOnline – SpO Storage Size / Scalar: value formatter: {{Math.floor(value).toString().substring(0,1)}},{{Math.floor(value).toString().substring(1,2)}}

Stats M365 – SharePoint Online

Shows top storage consuming sites, number of available and active sites, recent create team sites and sites which are most often visited.

Squared Up – Tile details:

ParameterValue
ClientIdYour client ID
ClientSecretYour client Secret
TenantIdYour tenant ID
TaskGet-MSGraphBetaData
GraphQry/reports/getSharePointSiteUsageDetail(period=’D30′)?`$format=application/json&`$select=siteUrl,isDeleted,lastActivityDate,storageUsedInBytes,&`$top=5000
DisplayItemNumber30
FilteredBy$_.isDeleted -ne $True
SortedBystorageUsedInBytes
SortDescendingTrue
Storage used in GB{{parseInt(value.storageUsedInBytes/1024000000)}}  
(1) Site Storage Used
ParameterValue
ClientIdYour client ID
ClientSecretYour client Secret
TenantIdYour tenant ID
TaskGet-MSGraphBetaData
GraphQry/reports/getSharePointSiteUsageSiteCounts(period=’D30′)?$format=application/json
DisplayItemNumber30
FilteredBy$_.isDeleted -ne $True
SortedByreportDate
(2) Site Number Report
ParameterValue
ClientIdYour client ID
ClientSecretYour client Secret
TenantIdYour tenant ID
TaskGet-MSGraphBetaData
GraphQry/groups?`$format=application/json&amp;`$filter=groupTypes/any(c:c+eq+’Unified’)
DisplayItemNumber30
SortedBycreatedDateTime
(3) Team Sites Created
ParameterValue
ClientIdYour client ID
ClientSecretYour client Secret
TenantIdYour tenant ID
TaskGet-MSGraphBetaData
GraphQry/reports/getSharePointSiteUsageDetail(period=’D30′)?`$format=application/json&amp;`$select=siteUrl,isDeleted,pageViewCount,lastActivityDate,storageUsedInBytes,storageAllocatedInBytes,visitedPageCount&amp;`$top=5000
DisplayItemNumber30
FilteredBy$_.isDeleted -ne $True -and $_.siteUrl -notMatch ‘yourtenantName-my’ -and $_.siteUrl -ine ‘https://yourtenantName.sharepoint.com/’
SortedBypageViewCount
(4) Site Page View Count

M365 – ExchangeOnline

Combines Exchange Online availability and performance aspects measured from different proxy locations with details about connecting Outlook Apps and Version with recent Mailbox Count- and Send / Receive statistics

Squared Up – Tile details:

(1) Exchange Online logo
Web Tile / HTML /

<center> <img src="https://squaredup.ourdomain.abc/CustomPicturesForSquaredUp/Exchange.png" height=240 width=240 valign=top> </center>

(2) Exo Logon Duration
Performance / Line Graph / Scope: Class NiCE Active 365 Component / Metric Exchange Online – Mailbox LogOn Duration (ExO)

(3) EWS Response time
Performance / Line Graph / Scope: Class NiCE Active 365 Exchange Online Probe Location/ Metric ExchangeOnline – EWS Response Time (ExO) Milliseconds

(4) Mailflow Receive Latency
Performance / Line Graph / Scope: Class NiCE Active 365 Exchange Online / Metric ExchangeOnline – Mail Flow Receive Latency (ExO)

(5) Measurementpoints
Status / Icons / Scope: Class NiCE Active 365 Exchange Online Probe Location

(6) Failed Free&Busy Checks
Performance / Line Graph / Scope: Class NiCE Active 365 Exchange Online / Metric ExchangeOnline – Number of Failed Free/Busy Checks (ExO)

(7) Failed Free&Busy Duration
Performance / Line Graph / Scope: Class NiCE Active 365 Exchange Online / Metric ExchangeOnline – Failed Free/Busy Duration using Test Accounts (ExO)

(8) Datacenter – Mailboxes
Performance / Line Graph / Scope: Class NiCE Active 365 Exchange Online Datacenter / Metric ExchangeOnline – Datacenter Mailbox Count (ExO)

ParameterValue
ClientIdYour client ID
ClientSecretYour client Secret
TenantIdYour tenant ID
TaskGet-MSGraphBetaData
GraphQry/reports/getEmailAppUsageAppsUserCounts(period=’D7′)?`&amp;$format=application/json
(9) Outlook Apps
ParameterValue
ClientIdYour client ID
ClientSecretYour client Secret
TenantIdYour tenant ID
TaskGet-MSGraphBetaData
GraphQry/reports/getEmailAppUsageVersionsUserCounts(period=’D7′)?`&amp;$format=application/json
(10) Outlook App Versions
ParameterValue
ClientIdYour client ID
ClientSecretYour client Secret
TenantIdYour tenant ID
TaskGet-MSGraphBetaData
GraphQry/reports/getMailboxUsageMailboxCounts(period=’D30′)?$format=application/json
DisplayItemNumber5
(11) Mailbox Count
ParameterValue
ClientIdYour client ID
ClientSecretYour client Secret
TenantIdYour tenant ID
TaskGet-MSGraphBetaData
GraphQry/reports/getEmailActivityCounts(period=’D7′)?$format=application/json
DisplayItemNumber5
(12) Send / Receive

Stats M365 – Groups

Shows recent created groups, those with most members, publicly available most storage consuming and more.

Squared Up – Tile details:

ParameterValue
ClientIdYour client ID
ClientSecretYour client Secret
TenantIdYour tenant ID
TaskGet-MSGraphBetaData
GraphQry/groups?`$format=application/json&amp;`$filter=groupTypes/any(c:c+eq+’Unified’)
SortDescendingTrue
SortedBycreatedDateTime
DisplayItemNumber10
(1) Recent Created
ParameterValue
ClientIdYour client ID
ClientSecretYour client Secret
TenantIdYour tenant ID
TaskGet-MSGraphBetaData
GraphQry/reports/getOffice365GroupsActivityDetail(period=’D7′)?$format=application/json
FilteredBy$_.isDeleted -ne ‘False’
SortedByexchangeMailboxStorageUsedInBytes
SortDecendingtrue
(2) Top Mail Storage Consumption
ParameterValue
ClientIdYour client ID
ClientSecretYour client Secret
TenantIdYour tenant ID
TaskGet-MSGraphBetaData
GraphQry/reports/getOffice365GroupsActivityDetail(period=’D7′)?$format=application/json
FilteredBy$_.isDeleted -ne ‘False’
SortedBymemberCount
SortDecendingtrue
(3) Top Member
ParameterValue
ClientIdYour client ID
ClientSecretYour client Secret
TenantIdYour tenant ID
TaskGet-MSGraphBetaData
GraphQry/groups?`$format=application/json&amp;`$filter=groupTypes/any(c:c+eq+’Unified’)
SortDescendingTrue
SortedBycreatedDateTime
DisplayItemNumber10
FilteredBy$_.visibility -ne ‘private’
(4) Public Groups
ParameterValue
ClientIdYour client ID
ClientSecretYour client Secret
TenantIdYour tenant ID
TaskGet-MSGraphBetaData
GraphQry/reports/getOffice365GroupsActivityDetail(period=’D7′)?$format=application/json
SortDescendingTrue
SortedByexchangeMailboxTotalItemCount
FilteredBy$_.isDeleted -ne ‘False’
(5) Top Mail Total Items
ParameterValue
ClientIdYour client ID
ClientSecretYour client Secret
TenantIdYour tenant ID
TaskGet-MSGraphBetaData
GraphQry/reports/getOffice365GroupsActivityDetail(period=’D7′)?$format=application/json
FilteredBy$_.isDeleted -ne ‘False’
SortedByexternalMemberCount
SortDescendingtrue
(6) Top External Member

Monitor O365 with SCOM 3 (3 of 4)

Squared Up is a rich dashboard solution for System Center Operations Manager.

From health state information, over performance data, alerts, SLA-reporting and agent – tasks all can be consumed.

The Visualization Layer

By providing great visualizations, interactive drill downs and many interfaces it helps to engage application owners, help desk, sysadmins, developers and even business aka end-users.

Direct integrations for REST-APIs, MS-SQL, Visio Layouts, Graphics, Websites, Azure – AppInsights, Azure – Log Analytics, Service Now and native HTML 5 support converts it to a central monitoring cockpit – “one pane of glass”.

Building dashboards is a very intuitive either via Drag & Drop or for advanced users by editing JSON within the browser directly.

Beside the excellent support for customers, and a forum offers a place for asking questions around SCOM, Azure Monitor and Squared Up itself of cause.

Squared Up & NiCE

Below, a few screenshots taken from customers’ environment. It uses NiCE’ starter dashboards.

M365 Service Availability and Alerts
M365 Service – End User Performance

Squared Up – More examples

To have a better idea what else can be done with proper dashboards a few more examples:

MS SQL Server 2014 as overview with Top N statistics in dark theme.
Dashboards for key users and an application specialists bringing Devices with IT in relation.
Another dashboards providing Application layer information and Server KPIs together.

Good to know

Note: By the time of writing, the Squared Up for SCOM is version 4.8.1 which was released in  October 2020.

Start by watching a few videos on Squared Ups Youtube channel: https://www.youtube.com/channel/UCJDfdB-kYP9gycVk_KTtn0Q 

Once you have some idea, download the free trial and install it with a few clicks.
Download: https://download.squaredup.com/product-releases/squaredup-for-scom/

Monitor O365 with SCOM 1 (1 of 4)

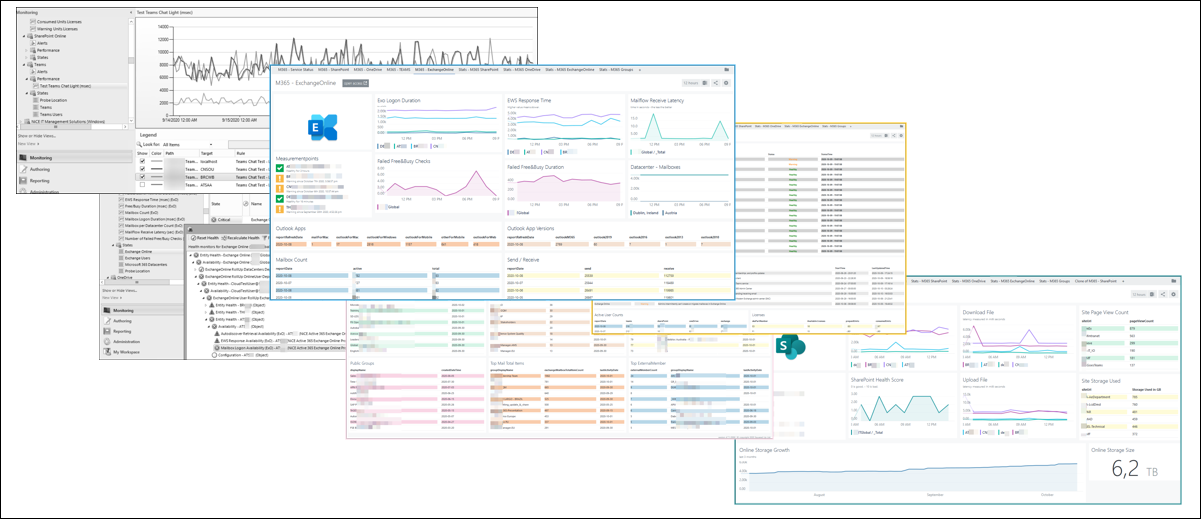
Microsoft 365 is a managed service which offers Exchange, SharePoint, Teams, OneDrive and many more services worldwide. With it, responsibilities of IT staff evolved and changed.

Monitoring however is still a crucial aspect. In this short article, I will explain why SCOM a perfect solution for this is.

Monitoring – What and Why?

With M365, IT staff do not need to take care anymore of VMs, Windows patching, configuring the global mail-routing or managing the SharePoint farm. Microsoft is doing it all, so why bother with monitoring?

Although all runs in the cloud, these are still usual applications. They have bugs, they fail from time to time, respond slowly and perhaps behave weird. – All like before 😉

You might have found you already in the situation that a user called and complained about poor SharePoint performance. Another user called and mentioned that the whole Australian team cannot make Teams calls. Perhaps the secretary of the CEO called nervously mentioning she can’t book appointments because Free & Busy is not working well.

Microsoft plays an open deck here and shares news about outages with world. – There is a twitter account which tells things like:

Microsoft 365 Status @MSFT365Status | 2020-07-14
We’re investigating an issue affecting access to SharePoint Online and OneDrive for Business that is primarily impacting customers in EMEA. Additional details can be found in the admin center under SP218450 and OD218456.

In the M365 Admin portal we have a section about “Service Health”. In it we can find messages like:

A very limited number of users may intermittently be unable to access Exchange Online via any connection method

… but is that affecting us in this moment?

So, we can only look sad and tell our users’ that we’re opening a ticket? Luckily, we can do more 🙂

Requirements

Your environment needs to be at least running SCOM 2012 R2. Either a Management Server or a SCOM- Gateway needs to be able to reach Microsoft via Internet. – Proxies are supported, too.

The hard monitoring work is done by NiCE Active 365 MP. The beautiful visualizations are leverage Squared Up for SCOM. – Last piece is the free Data On Demand Management Pack ( always up to date via MP Catalog ) which is used to retrieve M365 meta information to provide more context.

Good to know

Using Squared Up’s Open Access dashboards can be consumed by every user.
No licenses are required. 🙂

Visualizing SAP PI/PO with Squared Up

SAP Process Orchestration (or Integration) is a software within SAP which functions as data transformation gateway. It’s a central component of an SAP infrastructure and the standard way to communicate with external parties.

This post will show how to apply Squared Up’s “Single Pane of Glass” approach to SAP PI/PO.

Introduction

SAP PI/PO offers a SOAP interface that can be used to gather information about the system.
In our case we are interested about the ‘health state’ of the individual communication channels.

As SOAP expects a XML payload and responds then in XML a ‘transformation’ is required as Squared Up only works with RESTful APIs.

To have a solution that can be applied to different cases a free & opensource Management Pack for SCOM has been created. It serves well for this particular task and can be extend if needed.

Groundwork

SAP PI/PO

The configuration for SAP PO is rather simple. A normal user account needs to be created ( e.g.: in Active Directory ). In this example the user is called E11000.


In SAP PO – Identity Management then assign the roles of SAP_JAVA_NWADMIN_LOGVIEWER_ONLY and SAP_XI_APPL_SERV_USER


That’s all.

PowerShell – Test

Use the following code to test if all working as expected.

#global settings
$ErrorActionPreference = "stop"


#region Your_Configuration_Settings

$UserName      = 'E11000'
$PassWord      = 'ClearTextPassword'
$WebServiceUrl = 'https://servername:port/AdapterFramework/ChannelAdminServlet?party=*&service=*&channel=*&action=Status'

#endregion Your_Configuration_Settings


#region PREWORK Disabling the certificate validations

if ("TrustAllCertsPolicy" -as [type]) {
	$foo = 'already exist'
} else {
add-type -TypeDefinition @"
    using System.Net;
    using System.Security.Cryptography.X509Certificates;
    public class TrustAllCertsPolicy : ICertificatePolicy {
        public bool CheckValidationResult(
            ServicePoint srvPoint, X509Certificate certificate,
            WebRequest request, int certificateProblem) {
            return true;
        }
    }
"@
[Net.ServicePointManager]::CertificatePolicy = New-Object -TypeName TrustAllCertsPolicy
}

#endregion PREWORK


#region querying_SAP

$XMLNodeName   =  '//Channel'
$rtnMsg = ''

$header   = @{"Authorization" = "Basic "+[System.Convert]::ToBase64String([System.Text.Encoding]::UTF8.GetBytes($UserName+":"+ $PassWord))}

try {	
	$reqAnsw = Invoke-WebRequest -Uri $WebServiceUrl -UseBasicParsing -Headers $header -ContentType $ContentType
} catch {
	$rtnMsg = 'Failure during InvokeWebRequest' + $Error.ToString()
}

[xml]$content = $reqAnsw.Content
$elementList  = $content.DocumentElement.SelectNodes($XMLNodeName)

#endregion querying_SAP


#region converting_XML-To-PowerShellObjects

$allElements = New-Object -TypeName 'System.Collections.Generic.List[PSObject]'

$elementList | ForEach-Object {
  
	$tmpString = $_ | Out-String  
	$tmpEntry  = $tmpString -Split("`r`n")  
	$tmpObj    = New-Object -TypeName PSObject

	$tmpEntry | ForEach-Object {  

		if ($_ -match '[a-zA-Z0-9]') {
			$tmpEntryItm = $_ -Split("\s{1}\:\s{1}")   
			$tmpItmLeft  = $tmpEntryItm[0] -Replace("\s","")
			$tmpItmRight = $tmpEntryItm[1] -Replace("\s","")
			Add-Member -InputObject $tmpObj -MemberType NoteProperty -Name $tmpItmLeft -Value $tmpItmRight        
		}  
		
	} #end $tmpEntry | ForEach-Object {}

	$allElements.Add($tmpObj)

} #end $elementList | ForEach-Object {}

#endregion converting_XML-To-PowerShellObjects


#region verifying_result

$allElements | Out-GridView

#endregion verifying_result 

The result of Out-GridView shall look similar to this one:

SCOM

SCOM is here only used to run an Agent Task which queries the SOAP services and transforms the data to JSON.
The task consists of the Powershell script (mostly like above) which is then showing the results in Squared Up.

The agent task is part of a Management Pack named Windows.Computer.DataOnDemand.Addendum and can be downloaded via Community Catalog on  http://cookdown.com/scom-essentials/community-catalog/ or directly on GitHub https://github.com/Juanito99/Windows.Computer.DataOnDemand.Addendum .

After the Management Pack is important no further configuration in SCOM is required.

Squared Up

Dashboard Setup

Create an empty dashboard following the these steps:

1. Start with the SCOM Task tile
Select the SCOM Task Tile

2. Choose On-Demand Task (Grid)
Choose On-Demand Task (Grid)

3. Enter ANY Windows Server 2012 ( or higher ) which should query the PI/PO system.
Enter ANY Windows Server 2012 ( or higher )

4. Specify the task Get-RemoteSOAPServiceInfo (…)
Specify the task Get-RemoteSOAPServiceInfo (...)

5. Set at minimum the Overrides of PassWord UserName WebService URL and XMLNodeName
Set Overrides of PassWord UserName WebService URL and XMLNodeName

6. Choose which columns should be shown


7. Pick JSON as task return format
Pick json as task return format

8. Complete by enabling show column headers
Complete by enableing show column headers


The raw output should look similar to the one below:
Raw table format
The double hash tags ( ## ) are used later for improved visualization and can be disabled as Override Parameter.

Dashboard Styling

To make the dashboard now a bit more catchy, apply these steps.:

Edit the previously created SCOM task tile and select the Grid Columns section.

Start with editing column ‘Party‘ and paste in the following code:

{{#if (value.Party.substring(0,2) == "##") }} <span style="background-color:#E8E8E8;display: block;"> {{value.Party.replace("##","")}}  </span> {{else}}  {{value.Party}}  {{/if}}

Result after confirming with Done should be a grey background of every other row:

Result after confirming with Done

Add the same code with proper column names ( replace ‘Party’ with the corresponding one ) and the complete table will look good.

For completeness, here the code for ‘Direction‘ …

{{#if (value.Direction.substring(0,2) == "##") && (value.Direction.includes('OUTBOUND')) }} <span style="background-color:#E8E8E8;display: block;text-align: center;"> ▦ ->  </span>  {{elseif (value.Direction.substring(0,2) == "##") && (value.Direction.includes('INBOUND')) }} <span style="background-color:#E8E8E8;display: block;color:#0000ff;text-align: center;"> -> ▦  </span> {{elseif (value.Direction.substring(0,2) != "##") && (value.Direction.includes('INBOUND')) }} <span style="display: block;color:#0000ff;text-align: center;"> -> ▦ </span>   {{elseif (value.Direction.substring(0,2) != "##") && (value.Direction.includes('OUTBOUND')) }} <span style="display: block;text-align: center;"> ▦ -> </span>  {{/if}}

… and for ‘ChannelState‘:

{{#if (value.ChannelState.substring(0,2) == "##") && (value.ChannelState.includes('ERROR')) }} <span style="background-color:#E8E8E8;color:#ff0000;text-align: center;display: block;"> ✘  </span>  {{elseif (value.ChannelState.substring(0,2) == "##") && (value.ChannelState.includes('INACTIVE')) }} <span style="background-color:#E8E8E8;color:#000000;text-align: center;display: block;"> ⚪  </span> {{elseif (value.ChannelState.substring(0,2) == "##") && (value.ChannelState.includes('OK')) }} <span style="background-color:#E8E8E8;color:#00ff00;text-align: center;display: block;"> ✔  </span> {{elseif (value.ChannelState.substring(0,2) != "##") && (value.ChannelState.includes('ERROR')) }} <span style="color:#ff0000;text-align: center;display: block;"> ✘ </span>  {{elseif (value.ChannelState.substring(0,2) != "##") && (value.ChannelState.includes('INACTIVE')) }} <span style="color:#000000;text-align: center;display: block;"> ⚪  </span>  {{elseif (value.ChannelState.substring(0,2) != "##") && (value.ChannelState.includes('OK')) }} <span style="color:#00ff00;text-align: center;display: block;"> ✔  </span>  {{/if}} 

Last, but not least

If you have questions or comments, feel free to contact me.
You find me on twitter or on LinkedIn.

If the code isn’t running on your machine 😉
Or you like to add more features, please navigate the the corresponding GitHub site and raise an issue.
https://github.com/Juanito99/Windows.Computer.DataOnDemand.Addendum/issues