The Management Pack
Core is a small executable runs on an OpsMgr Management Server or a OpsMgr – Gateway and performs the tests and synthetic transactions.
Only a few configuration steps are required 🙂
Active 365 MP Architecture
Two different monitoring modes are available.
If all Mailboxes have been already migrated, Online only Mode is the correct option. – Both support proxies. The architecture looks as below:
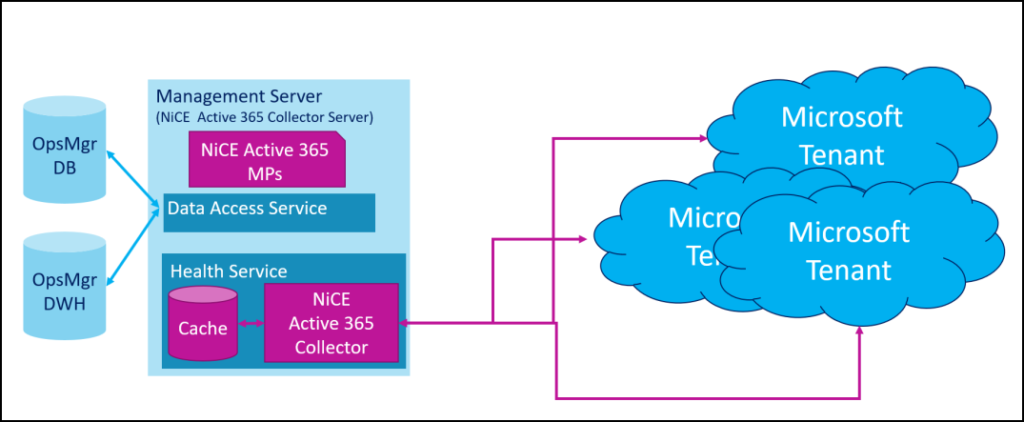
If Mailbox migration is still ongoing – or if some Exchange resources need to be kept on-premises, the hybrid mode fits.
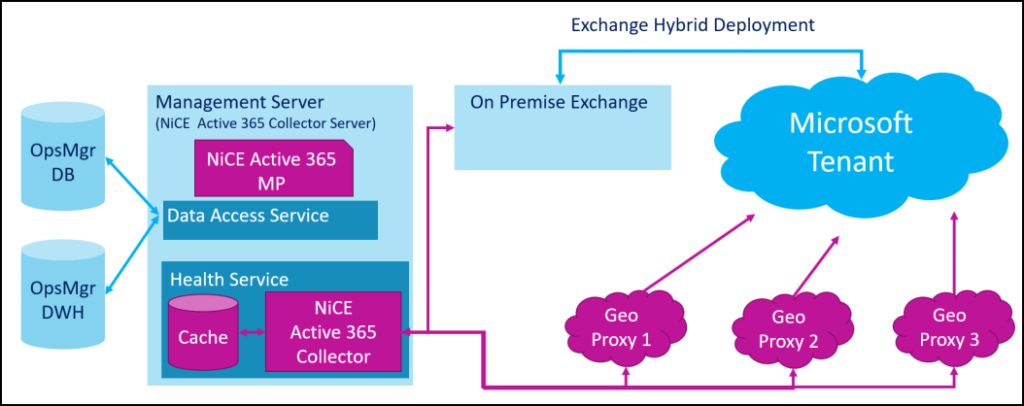
Discovery
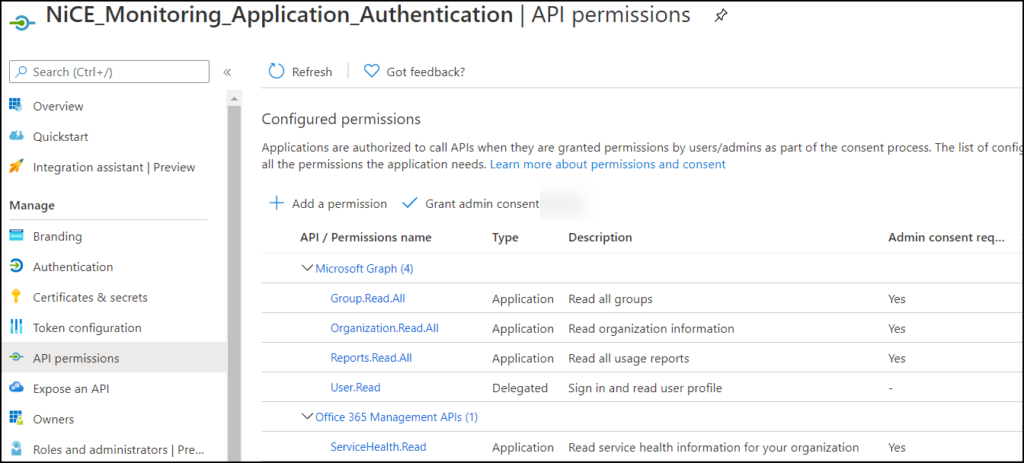
To make SCOM aware of your M365 tenant, some preparation steps are required.
User accounts with permissions on a SharePoint site, OneDrive and a Mailbox are needed. Additional permissions are configured within Azure Active Directory / Enterprise Applications.
Information about the user accounts need to be stored in configuration files.
Monitors
After details about the M365 tenant have been discovered, corresponding objects are created and appear in the diagram vies. Monitors can be enabled to perform many different tests to ensure and measure service availability.
| M365 / Exchange (ExO pure or Hybrid) – EWS Response Availability / Time (msec) – Autodiscover Retrieval Availability – Mailbox Logon Availability / Duration – Free / Busy Check – Mailbox Send & Receive Availability – Mailbox Receive Latency – Autodiscover Retrieval Duration – Service Health Status | M365 / SharePoint Online – SpO Logon Latency – SpO File Up- and Download Check – SpO Log On Latency – SpO Health Score – Request Duration – IIS Request Latency – SpO Site Availability – SpO Storage Usage (GB) Summary – SpO Service Health Status |
| M365 / OneDrive – OneDrive Log On Latency – OneDrive File Up- and Download Check – OneDrive Availability – OneDrive Service Health Status | M365 / Teams – Monitor Teams Chat – Test LightTeam Chat Availability – Team Service Health Status |
M365 Monitors – All Services Health Rollups
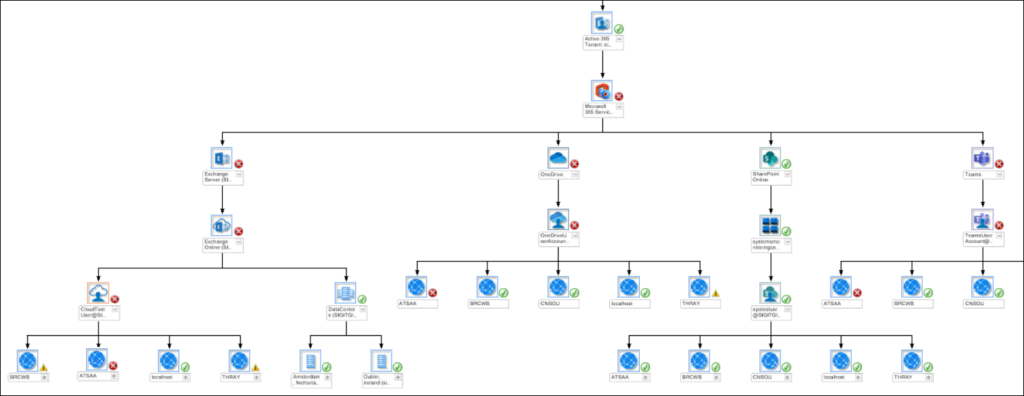
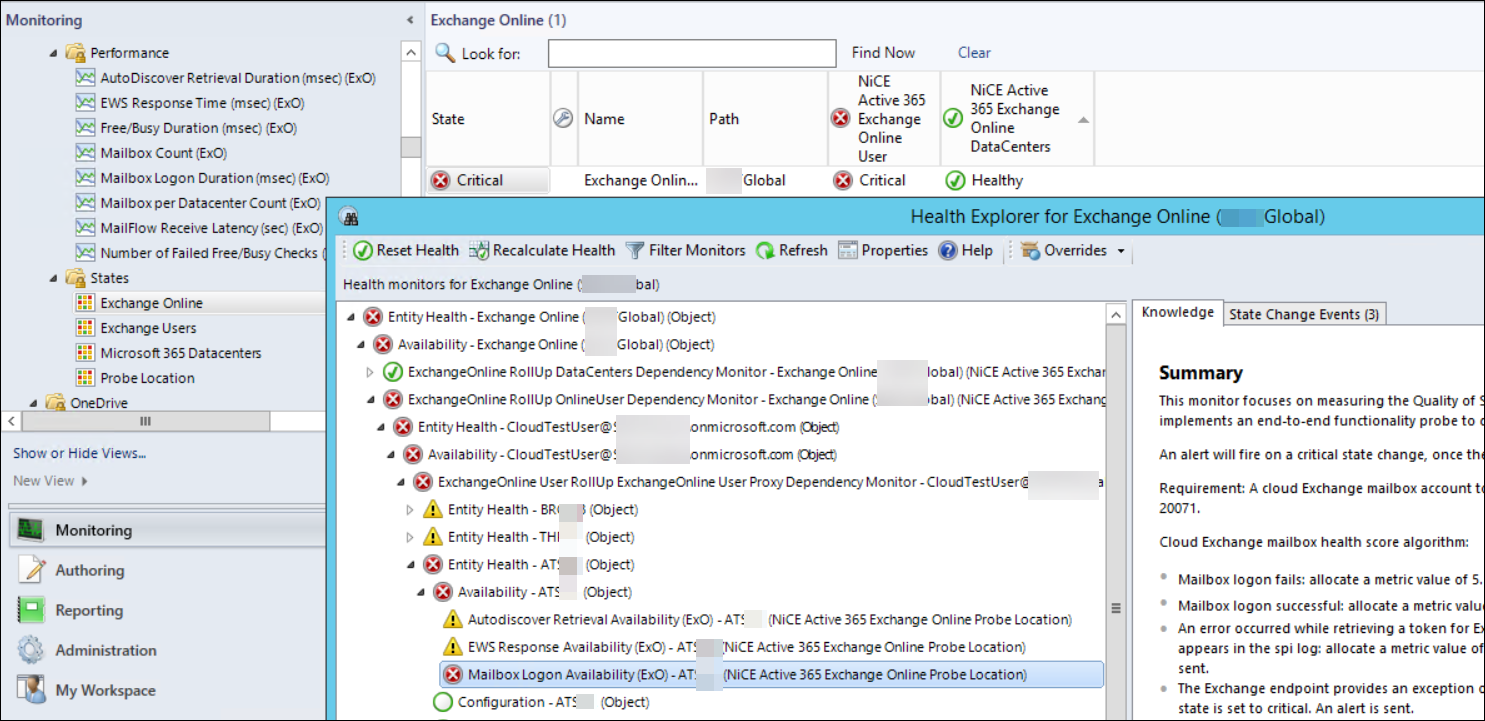
M365 – Exchange – Health State and Rollup
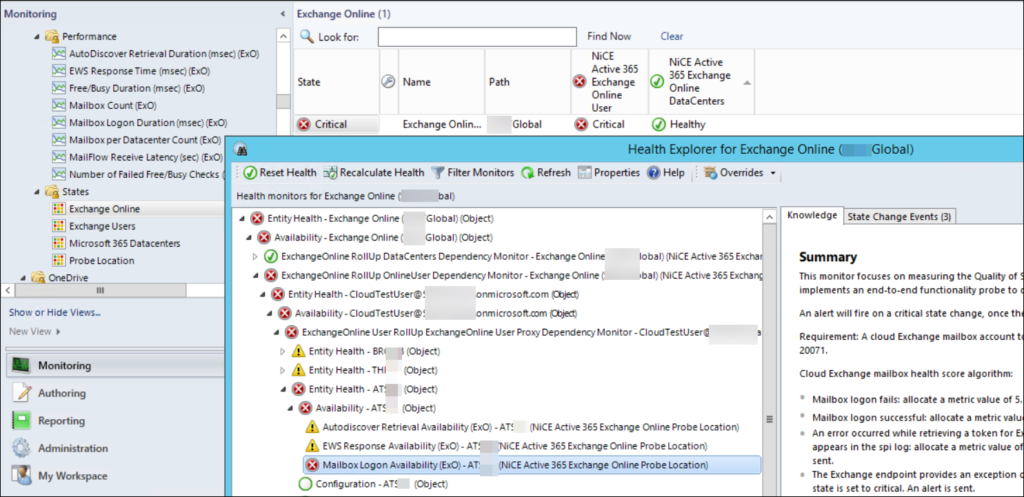
Monitors allow customization of thresholds as the default do not suit every environment. If needed, alerting can be enabled to notify about a decreasing performance or loss of service.
Performance Rules
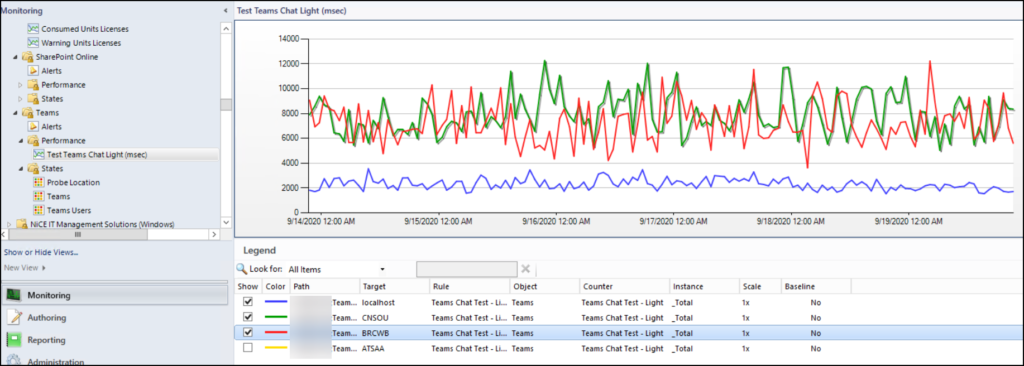
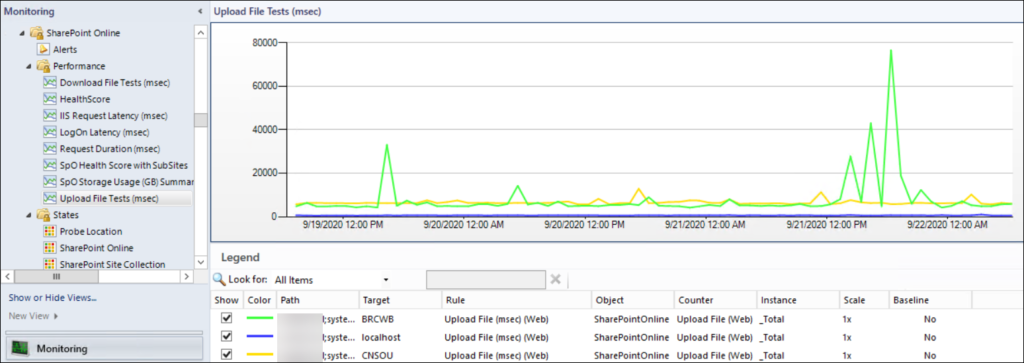
Most transactions that are realized as a Monitor also store the retrieved value and allow reporting via graph plotting and understand trends.
E.g. Rules track Receive Latency, File Up- and Download Time and Request Duration
On Tenant Level:
– Active M365 License Units
– Consumed M365 License Units
– Warning M365 License Units
– Active Users
– Available M365 Licenses
– Identity Service Health, MDM Service Health, M365 Portal Health, M365 Client Application Health, Subscription Health, Number of ExO Mailboxes and others
On Services Level:
M365 – Teams Chat – Performance from 3 Proxy locations
M365 – Exchange Online – Number of Failed Free Busy checks

M365 – SharePoint Online – Upload speed from 3 Proxy locations
Proxy Locations
To simulate the speed and connectivity from different points in the organization, proxy locations can be configured. As the name states, it is based on web-proxy services that need to be stored in a configuration file.
Based on this information then, tests and probes are sent via the web-proxies, too.
Good to know
Note: By the time of writing, the Active 365 MP is version 3.1. At October 2020 NiCE released already version 3.2!
Download: https://www.nice.de/active-365-mp/
One thought on “Monitor O365 with SCOM 2 (2 of 4)”