
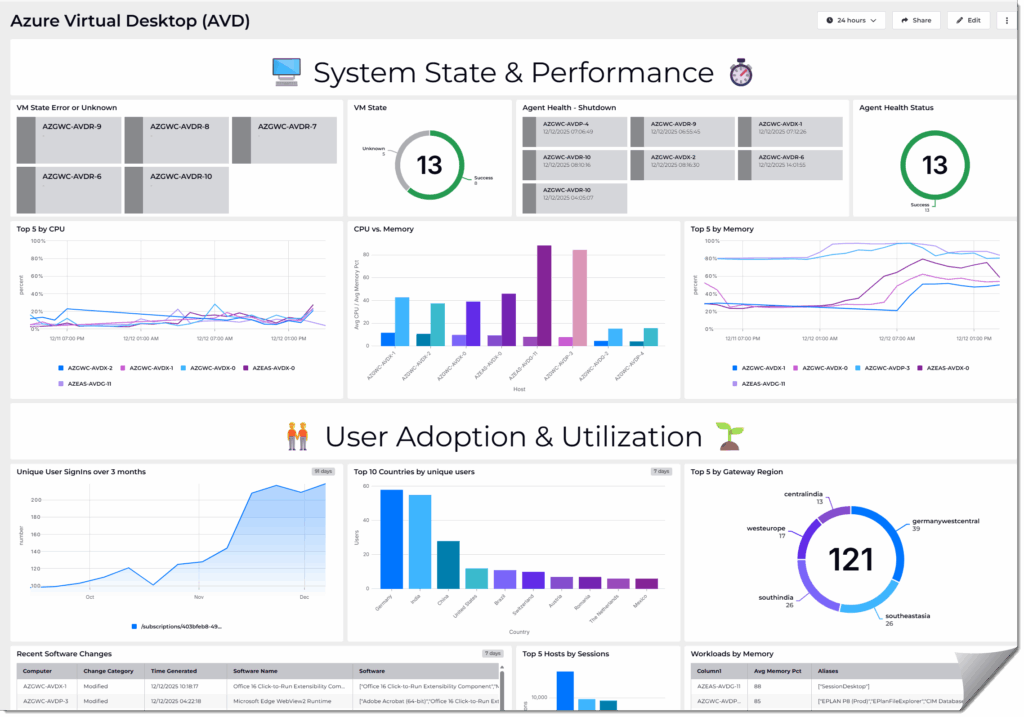
Learn how I built a clean, insight‑packed Azure Virtual Desktop dashboard using SquaredUp Cloud —powered by focused KQL queries and designed to surface everything from infrastructure health to real‑world usage at a glance.
Introduction
A consolidated dashboard provides a unified operational view across infrastructure, application performance, and user‑level utilization. Instead of navigating multiple Azure portal blades with fragmented metrics, a single pane of glass allows you to correlate signals end‑to‑end, accelerate root‑cause analysis, and maintain consistent observability across the entire Azure Virtual Desktop stack. This reduces context switching, improves diagnostic accuracy, and supports faster, data‑driven decision‑making.
Dashboard Software
SquaredUp Cloud is a SaaS-based operational intelligence platform that unifies visibility across on‑premises and cloud environments—connecting to over 60 data sources (including Azure, AWS, GCP, DevOps tools, and infrastructure monitoring systems) without requiring data ingestion or new databases. It offers flexible, drag‑and‑drop dashboards, real‑time monitoring with notifications and RollUp status summaries, and built‑in sharing, analytics, and search features to help teams make faster, data‑driven decisions.
Getting started | SquaredUp Cloud Support
Sections
The dashboard is segregated in 5 categories. Each category itself consist of one or more queries that provide insights.
1. VM State & Agent Health
2. Performance Metrics
3. User & Connection Analytics
4. Configuration & Software Changes
5. Session & App Usage
Prerequisites
Diagnostic settings
All information on the dashboard rely on quires that obtain data from a Log Analytics Workspace. The following link explains how to configure it.: Azure Virtual Desktop diagnostics log analytics – Azure – Azure Virtual Desktop | Microsoft Learn
Also Change Tracking is configured in this environment which helps to track important events on Virtual Machines such as as Software- and Patch Installs.
Azure Change Tracking and Inventory documentation | Microsoft Learn
Important Note!
In the code you will find “nwtraders.msft” which is the Active Directory Domain in which the computers reside.
All Virtual Machines which are used for Azure Virtual Desktop have “AVD” in their computer name.
1. VM State & Agent Health
VM State Error or Unknown
Purpose: Displays session hosts with their current state (Running or Stopped/Unavailable) and last seen time based on agent health and heartbeats.
Why Useful: Quickly identifies hosts that are unavailable or in error state.
Benefit: Enables fast troubleshooting and ensures users can connect to healthy hosts.
let hosts =
WVDAgentHealthStatus
| summarize arg_max(TimeGenerated, *) by SessionHostName
| extend HostNorm = tolower(replace(@'\.nwtraders\.msft$', '',SessionHostName));
let hb =
Heartbeat
| where TimeGenerated > ago(30m)
| summarize LastHeartbeat = max(TimeGenerated) by Computer
| extend HostNorm = tolower(replace(@'\.nwtraders\.msft$', '',Computer));
hosts
| join kind=leftouter hb on HostNorm
| extend Status = iff(isnull(LastHeartbeat) or LastHeartbeat < ago(5m), "Stopped/Unavailable", "Running")
| project Host = toupper(HostNorm), Status, LastSeen = LastHeartbeat
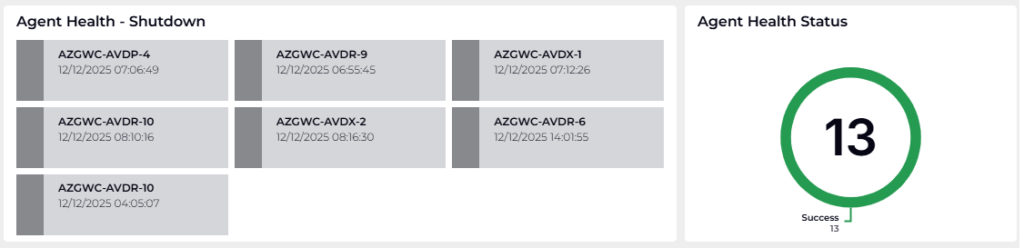
| order by HostAgent Health – Shutdown
Purpose: Shows the latest health status for each AVD session host within the last day.
Why Useful: Detects shutdown or connectivity issues early.
Benefit: Prevents downtime by allowing proactive remediation.
WVDAgentHealthStatus
| where TimeGenerated between (ago(1d) .. now())
| summarize arg_max(TimeGenerated,*) by SessionHostName, Status
| project Host=replace(".nwtraders.msft","",SessionHostName), Status, TimeGenerated
Agent Health Status
Purpose: Provides the most recent health status for each AVD session host, sorted alphabetically.
Why Useful: Offers a clear snapshot of host health for operational visibility.
Benefit: Simplifies monitoring and supports SLA compliance.
WVDAgentHealthStatus
| where TimeGenerated between (ago(1d) .. now())
| summarize arg_max(TimeGenerated, *) by SessionHostName
| project Host = replace(@'\.nwtraders\.mfst$','',SessionHostName), Status, TimeGenerated
| order by Host asc
2. Performance Metrics
Top 5 Hosts by CPU Usage
Purpose: Identifies the top 5 AVD VMs by average CPU usage over the last day and calculates hourly averages.
Why Useful: Highlights resource-heavy hosts that may need scaling or optimization.
Benefit: Improves performance and user experience by balancing workloads.
let cpuPerf =
Perf
| where Computer contains "-AVD"
| where ObjectName == "Processor"
| where CounterName == "% Processor Time"
| where iff(isempty(InstanceName), true, InstanceName in~ ("_Total","Total","total"))
| extend ComputerKey = replace(".nwtraders.msft","",Computer);
let top5 =
cpuPerf
| where TimeGenerated > ago(1d)
| summarize AvgCPU = avg(CounterValue) by ComputerKey
| top 5 by AvgCPU desc
| project ComputerKey;
cpuPerf
| where TimeGenerated > ago(1d)
| where ComputerKey in (top5)
| summarize Avg5m = avg(CounterValue) by ComputerKey, bin(TimeGenerated, 5m)
| summarize HourlyAvg = avg(Avg5m) by ComputerKey, bin(TimeGenerated, 1h)
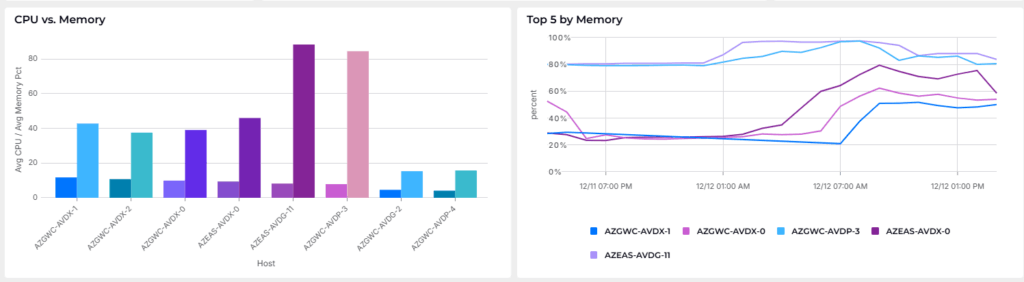
| order by ComputerKey, TimeGeneratedCPU & Memory Summary per Host
Purpose: Summarizes average CPU (%) and memory committed (%) per host over the last 24 hours.
Why Useful: Provides a holistic view of resource consumption.
Benefit: Supports capacity planning and cost optimization.
let cpuPerf =
    Perf
    | where ObjectName == "Processor"
    | where CounterName == "% Processor Time"
    | where Computer contains "-AVD"
    | where iff(isempty(InstanceName), true, InstanceName in~ ("_Total","Total","total"))
    | extend ComputerKey = Computer;
let cpuAgg =
    cpuPerf
    | where TimeGenerated > ago(1d)
    | summarize AvgCPU = avg(CounterValue) by ComputerKey
    | project Host = replace(".nwtraders.msft","",ComputerKey), AvgCPU;
let memPerf =
    Perf
    | where ObjectName == "Memory"
    | where CounterName == "% Committed Bytes In Use"
    | where Computer contains "-AVD"
    | extend ComputerKey = Computer;
let memAgg =
    memPerf
    | where TimeGenerated > ago(1d)
    | summarize AvgMemoryPct = avg(CounterValue) by ComputerKey
    | project Host = replace(".nwtraders.msft","",ComputerKey), AvgMemoryPct;
cpuAgg
| join kind=fullouter memAgg on Host
| project Host, AvgCPU, AvgMemoryPct
| order by CPU=AvgCPU desc, RAM=AvgMemoryPct desc
Top 5 Hosts by Memory Usage
Purpose: Finds the top 5 AVD VMs by average memory usage (%) over the last day and computes hourly averages.
Why Useful: Detects memory bottlenecks that could degrade performance.
Benefit: Ensures smooth operation by addressing resource constraints early.
let memPerf =
    Perf
    | where Computer contains "-AVD"
    | where ObjectName == "Memory"
    | where CounterName == "% Committed Bytes In Use"
    | extend ComputerKey = replace(".nwtraders.msft","",Computer);
// Step 2: Identify Top 5 VMs by Avg Memory % used
let top5 =
    memPerf
    | where TimeGenerated > ago(1d)
    | summarize AvgMemPct = avg(CounterValue) by ComputerKey
    | top 5 by AvgMemPct desc
    | project ComputerKey;

// Step 3: Calculate 5‑minute and hourly averages for those Top 5
memPerf
| where TimeGenerated > ago(1d)
| where ComputerKey in (top5)
| summarize Avg5m = avg(CounterValue) by ComputerKey, bin(TimeGenerated, 5m)
| summarize HourlyAvg = avg(Avg5m) by ComputerKey, bin(TimeGenerated, 1h)
| order by ComputerKey, TimeGenerated
3. User & Connection Analytics

Weekly Unique Users (90 Days)
Purpose: Counts distinct users per week from WVDConnections over the last 90 days.
Why Useful: Tracks adoption trends and user engagement.
Benefit: Informs capacity planning and licensing decisions.
WVDConnections
| where TimeGenerated between (ago(90d) .. now())
| summarize UniqueUsers = dcount(UserName) by WeekStart = startofweek(TimeGenerated)
| order by WeekStart asc
Top Countries by Unique Users (30 Days)
Purpose: Aggregates distinct users per country and returns the top 10 countries.
Why Useful: Provides geographic usage insights for compliance and scaling.
Benefit: Supports regional resource allocation and security considerations.
let daysAgo = 30d;
WVDConnections
| where TimeGenerated > ago(daysAgo)
| summarize NumberOfConnections = count() by UserName, ClientIPAddress
| order by NumberOfConnections desc
| extend ip_location = parse_json(geo_info_from_ip_address(ClientIPAddress))
| extend Country = tostring(ip_location.country), State = tostring(ip_location.state), City = tostring(ip_location.city)
| where isnotempty(Country)
| summarize Users=dcount(UserName) by Country
| top 10 by  Users
Top Gateway Regions (24 Hours)
Purpose: Counts distinct users per GatewayRegion and returns the top 5 regions.
Why Useful: Shows where users connect most frequently.
Benefit: Optimizes gateway placement for better latency and user experience.
WVDConnections
| where TimeGenerated between (ago(1d) .. now())
| summarize Users=dcount(UserName) by GatewayRegion
| top 5 by  Users
4. Configuration & Software Changes
Latest Software Changes on AVD Hosts
Purpose: Audits recent software changes on AVD hosts.
Why Useful: Detects unauthorized or unexpected changes.
Benefit: Reduces risk and ensures compliance.
ConfigurationChange
| where Computer contains "AVD"
| where SoftwareType != "Patch"
| where ConfigChangeType == "Software"
| project SoftwareName, ChangeCategory, Computer, TimeGenerated
| summarize arg_max(TimeGenerated,*), Software=make_set(SoftwareName) by Computer, ChangeCategory
5. Session & App Usage

Top Hosts by Active Sessions
Purpose: Sums ActiveSessions per SessionHostName over the last 24 hours.
Why Useful: Identifies heavily used hosts that may need scaling.
Benefit: Improves load balancing and prevents performance degradation.
WVDAgentHealthStatus
| where TimeGenerated between (ago(1d) .. now())
| summarize TotalSessions = sum(toint(ActiveSessions)) by SessionHostName
| top 5 by TotalSessions desc
| project Host=replace(".sig.dom","",SessionHostName), TotalSessions
Workloads by Memory
Purpose: Identify the top 5 AVD session hosts with the highest average memory usage in the past day and link them to their associated resource aliases.
Why Useful: Helps quickly pinpoint memory-heavy hosts and correlate them with workloads for targeted troubleshooting and optimization.
Benefit: Enables proactive scaling and performance tuning to prevent session degradation and improve user experience.
let timeframe = 1d;
let memPerf =
    Perf
    | where TimeGenerated > ago(timeframe)
    | where ObjectName == "Memory"
    | where CounterName == "% Committed Bytes In Use"
    | where Computer contains "-AVD"
    | extend ComputerKey = Computer;
let top5 =
    memPerf
    | summarize AvgMemoryPct = avg(CounterValue) by ComputerKey
    | top 5 by AvgMemoryPct desc
    | extend Host = tolower(replace(@'\.sig\.dom$', '',ComputerKey))
    | project Host, AvgMemoryPct;
// Collect all aliases observed per host in the timeframe
let aliasesAll =
    WVDConnections
    | where TimeGenerated > ago(timeframe)
    | where isnotempty(ResourceAlias)
    | extend Host = tolower(replace(@'\.sig\.dom$', '',tostring(SessionHostName)))
    | summarize Aliases = make_set(ResourceAlias, 20) by Host;
top5
| join kind=leftouter aliasesAll on Host
| project toupper(Host), round(AvgMemoryPct), Aliases
Top ResourceAliases (90 Days)
Purpose: Highlights most-used apps and produces weekly time series of unique users per alias.
Why Useful: Shows app popularity trends.
Benefit: Guides application lifecycle management and prioritization.

let Top5Aliases =
    WVDConnections
    | where TimeGenerated between (ago(90d) .. now())
    | where ResourceAlias != "<>"
    | summarize TotalUniqueUsers = dcount(UserName) by ResourceAlias
    | top 5 by TotalUniqueUsers desc
    | project ResourceAlias;
WVDConnections
| where TimeGenerated between (ago(90d) .. now())
| where isnotempty(ResourceAlias)
| where ResourceAlias in (Top5Aliases)
| summarize UniqueUsers = dcount(UserName) by ResourceAlias, WeekStart = startofweek(TimeGenerated)
| order by WeekStart asc, ResourceAlias asc
Top 10 by Users Per Host
Purpose
The query identifies which applications have the highest average number of users per session host over the last 30 days.
Why Useful
It helps reveal where host capacity is most heavily consumed and where potential bottlenecks may occur.
Benefit
Teams can use these insights to optimize scaling, improve performance, and allocate resources more efficiently
let lookback = 30d;
let usersPerApp =
    WVDConnections
    | where TimeGenerated > ago(lookback)
    | where State == "Completed"
    | where ResourceAlias !in ("SessionDesktop", "<>")
    | summarize Users = count_distinct(UserName)
              by ResourceAlias;
let hostsPerApp =
    WVDConnections
    | where TimeGenerated > ago(lookback)
    | where State == "Completed"
    | where ResourceAlias !in ("SessionDesktop", "<>")
    | summarize Hosts = count_distinct(SessionHostName)
              by ResourceAlias;
usersPerApp
| join kind=inner hostsPerApp on ResourceAlias
| extend UsersPerHost = todouble(Users) / todouble(Hosts)
| top 10 by UsersPerHost
App Launches vs. Distinct Apps vs. Hosts
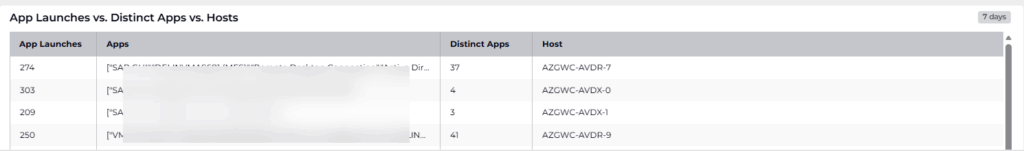
Purpose
The query analyzes the last 30 days of completed RemoteApp connections to determine how many distinct apps and total launches occurred per session host.
Why Useful
It helps identify usage patterns and app diversity on each host to better understand workload distribution.
Benefit
Teams can use these insights to optimize host sizing, improve performance, and plan capacity more accurately.
let lookback = 30d;
WVDConnections
| where TimeGenerated > ago(lookback)
| where State == "Completed"
| where ConnectionType == "RAIL"
| where isnotempty(ResourceAlias)
| summarize
    DistinctApps = count_distinct(ResourceAlias),
    AppLaunches  = count(),
    Apps         = make_set(ResourceAlias)
   by Host=replace(".nwtraders.msft","",SessionHostName)
Conclusion
Adding all these queries into a dashboard will provide you key aspects of your AVD environment in one page. – Btw. With 2 clicks it is possible to also add “Costs” into the page. For this demonstration though it is not interesting 😉