In a nutshell
Azure Storage telemetry and configuration data lives in many different places across the Azure portal. This post focuses on the KQL queries and PowerShell logic that extract, shape, and correlate growth, usage, cost, and configuration signals into a unified view.
SquaredUp Cloud is used as dashboard solution. The free tier already allows sharing with colleagues – The code will work also in other products 😉
This entire solution is open source. Costs occur only for the data ingested to the Log Analytics workspace.
Introduction (Extended)
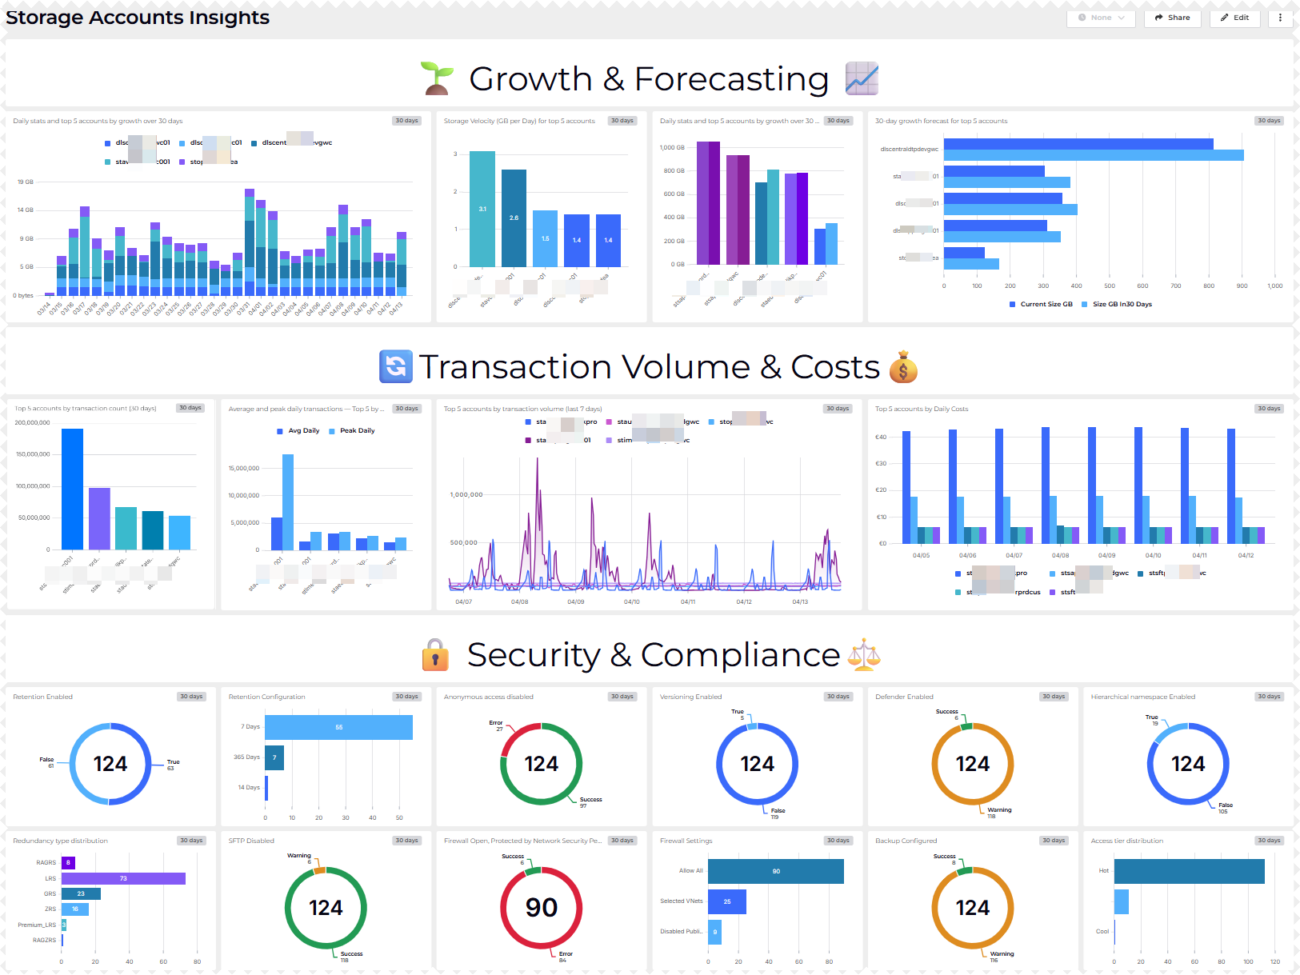
This dashboard provides a structured analysis of Azure Storage accounts using KQL-based metrics derived from usage, transaction, cost, and configuration data.
It focuses on identifying growth patterns, usage intensity, and cost drivers over time, while also highlighting key security, data protection, and access-related settings.
The queries analyze daily storage size changes, growth velocity, and projected capacity trends, enabling comparison between current and historical states for the largest and fastest-growing accounts. Transaction metrics are used to identify highly active accounts and to distinguish average versus peak usage behavior.
In addition, the dashboard summarizes configuration posture across the storage estate, including retention, versioning, backup, network access, redundancy, access tiering, and feature enablement (for example, SFTP, hierarchical namespace, Defender).
Table of Content
- Introduction
- Table of Content
- Solution Brief
- Prerequisites
- System Assigned Managed Identity
- Azure Automation Account
- PowerShell Runbook – Monitor-Blobsotrages.ps1
- Required Script Adjustments
- KQL Queries
- Growth & Forecasting
- Transaction Volume & Costs
- Security & Compliance
- Dashboard Software
- Conclusion
Solution Brief
The information shown on the dashboard is distributed among various places. A PowerShell script Monitor-Blobstorages.ps1 (GitHub Repository), which needs to run hourly within an Automation Account queries the different APIs and stores them in a custom log analytics table called blobmonitor_CL.
AzLogDcrIngestPS, a module by Morten Knudsen takes care for all tasks related to log ingestion.
Prerequisites
System Assigned Managed Identity
System assigned Managed Identity is required on the Automation Account which runs the PowerShell script. Read how on: Using a system-assigned managed identity for an Azure Automation account | Microsoft Learn
Azure Automation Account
Grant the Managed Identity read permissions via the READER role and Storage Account Key Operator Service Role role assigned on Management Group level to find all Storage Accounts and other relevant settings.
PowerShell Runbook – Monitor-Blobstorages.ps1
This PowerShell script serves as the data collection layer for the dashboard. It runs as an Azure Automation–style runbook and gathers inventory, usage, cost, and configuration data for Azure Storage accounts across multiple subscriptions.
The script authenticates using a managed identity and retrieves required secrets from Azure Key Vault. Storage accounts and core metadata are queried via Azure Resource Graph, after which each account is processed to collect additional details such as size, transaction activity, cost data, backup configuration, Defender status, and network-related settings.
All collected data is normalized into a flat schema aligned with a Data Collection Rule (DCR) and then ingested into Log Analytics via a Data Collection Endpoint (DCE). This makes the data directly available for KQL queries and dashboard visualizations.
Required script adjustments
The following section Powershell code must be adopted to fit YOUR environment. – Contact me for help.
Please note! Before running the script the LogIngestApp must be created upfront. Also the DCE is to be created before using it.
Check mortenknudsen.net for details on how to setup the AzLogDcrIngest framework.
#region customize these variables for your environment

$tenantId                                   = YOURTENANTID
$azIOKeyVaultName                           = KEYVAULTNAME
$azIOKeyName                                = NAMEOFTHEKEYFORLOGINGESTION
$azKVLogIngestKey                           = Get-AzKeyVaultSecret -VaultName $azIOKeyVaultName -Name $azIOKeyName
$azKVLogIngestVal                           = $azKVLogIngestKey.SecretValue
$LogIngestAppSecret                         = $azKVLogIngestVal | ConvertFrom-SecureString -AsPlainText
$LogIngestAppId                             = CLIENTIDFORLOGINGESTIONAPPLICATION_CREATED_FOR_AZDCRLOGINGEST

$LogAnalyticsWorkspaceResourceId            = "/subscriptions/ID/resourceGroups/RSGNAME/providers/Microsoft.OperationalInsights/workspaces/LOGANALYTICSWORKSPACENAME"

$AzDcrResourceGroup                         = "rsg-YOUR_RSG_NAME-dcr"
$AzDcrPrefix                                = "prd"

$AzDceName                                  = "dce-YOUR_DCE_NAME"
$TableName                                  = "blobmonitor"
$AzDcrName                                  = "dcr-prd-" + $TableName + "_CL"

$PowershellReadAccessClientIDKey            = Get-AzKeyVaultSecret -VaultName $azIOKeyVaultName -Name "PowershellReadAccessClientID"
$PowershellReadAccessClientIDVal            = $PowershellReadAccessClientIDKey.SecretValue | ConvertFrom-SecureString -AsPlainText

$PowershellReadAccessClientSecretKey        = Get-AzKeyVaultSecret -VaultName $azIOKeyVaultName -Name "PowershellReadAccessClientSecret"
$PowershellReadAccessClientSecretVal        = $PowershellReadAccessClientSecretKey.SecretValue | ConvertFrom-SecureString -AsPlainText

#endregion
KQL Queries
🌱 Growth & Forecasting 📈
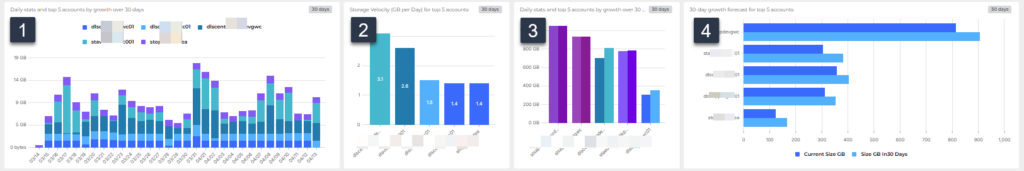
1) Daily stats and top 5 accounts by growth over 30 days
// This KQL query analyzes the growth of storage accounts over the past 30 days by calculating daily maximum and minimum sizes, and then determining the growth from the previous day. It identifies the top 5 storage accounts with the highest total growth.

let DailyStats =
    blobmonitor_CL
    | where TimeGenerated > ago(30d)
    | where SizeInBytes !=0
    | where SizeInBytes !=1
    | summarize DailyMaxSize = max(SizeInBytes), DailyMinSize = min(SizeInBytes) by StorageAccount, Day = bin(TimeGenerated, 1d)
    | order by StorageAccount asc, Day asc
    | serialize
    | extend DailyDifference = DailyMaxSize - DailyMinSize;
let GrowthStats =
    DailyStats
    | extend PrevAccount = prev(StorageAccount)
    | extend PrevDailyMaxSize = prev(DailyMaxSize)
    | extend PreviousDayMaxSize = iif(StorageAccount == PrevAccount, PrevDailyMaxSize, long(null))
    | extend GrowthFromPreviousDay = DailyMaxSize - PreviousDayMaxSize;
let TopAccounts =
    GrowthStats
    | summarize TotalGrowth = sum(GrowthFromPreviousDay) by StorageAccount
    | top 5 by TotalGrowth desc;
DailyStats
| join kind=inner (TopAccounts) on StorageAccount
| project StorageAccount, Day, DailyMaxSize, DailyMinSize, DailyDifference;
TopAccounts
| project StorageAccount, TotalGrowth
Purpose: Measure daily storage size changes and identify the top growth accounts over 30 days.
Why Useful: It quickly highlights which storage accounts are expanding the fastest.
Benefit: Teams can prioritize capacity planning and cost control for the highest-growth accounts.
2) Storage Velocity (GB per Day) for top 5 accounts
// The first part of the query calculates daily statistics for each storage account, including the maximum and minimum size in bytes, and the difference between them. It excludes entries with sizes of 0 or 1 byte (transient script errors).

let DailyStats =
    blobmonitor_CL
    | where TimeGenerated > ago(30d)
    | where SizeInBytes !=0
    | where SizeInBytes !=1
    | summarize DailyMaxSize = max(SizeInBytes), DailyMinSize = min(SizeInBytes) by StorageAccount, Day = bin(TimeGenerated, 1d)
    | order by StorageAccount asc, Day asc
    | serialize
    | extend DailyDifference = DailyMaxSize - DailyMinSize;
let GrowthStats =
    DailyStats
    | extend PrevAccount = prev(StorageAccount)
    | extend PrevDailyMaxSize = prev(DailyMaxSize)
    | extend PreviousDayMaxSize = iif(StorageAccount == PrevAccount, PrevDailyMaxSize, long(null))
    | extend GrowthFromPreviousDay = DailyMaxSize - PreviousDayMaxSize;
let TopAccounts =
    GrowthStats
    | summarize TotalGrowth = sum(GrowthFromPreviousDay) by StorageAccount
    | top 5 by TotalGrowth desc;
GrowthStats
| join kind=inner (TopAccounts) on StorageAccount
| project StorageAccount, Day, DailyDifferenceGB = DailyDifference / 1e9
| order by StorageAccount asc, Day asc
| summarize StorageVelocityGBPerDay = round(avg(DailyDifferenceGB),1) by StorageAccount
| order by StorageVelocityGBPerDay desc;
Purpose: Calculate daily storage velocity for the top growth accounts in GB per day.
Why Useful: It turns raw size deltas into an easy trend metric for each account.
Benefit: Teams can forecast growth pressure and adjust storage strategy earlier.
3) Daily stats and top 5 accounts by growth over 30 days
// Identifies the top 5 storage accounts with the largest current size and calculates their growth over the past 30 days by comparing the maximum size at the start and end of the period. It also provides a daily size series for those top accounts.

let DailyStats =
    blobmonitor_CL
    | where TimeGenerated > ago(30d)
    | where SizeInBytes > 1
    | summarize DailyMaxSize = max(SizeInBytes) by StorageAccount, Day = bin(TimeGenerated, 1d)
    | order by StorageAccount asc, Day asc
    | serialize;
let CurrentSizes =
    DailyStats
    | summarize arg_max(Day, DailyMaxSize) by StorageAccount
    | project StorageAccount, CurrentSizeBytes = DailyMaxSize;
let StartSizes =
    DailyStats
    | summarize arg_min(Day, DailyMaxSize) by StorageAccount
    | project StorageAccount, StartSizeBytes = DailyMaxSize;
let Top5Largest =
    CurrentSizes
    | top 5 by CurrentSizeBytes desc;
Top5Largest
| join kind=inner (StartSizes) on StorageAccount
| extend GrowthBytes = CurrentSizeBytes - StartSizeBytes
| project StorageAccount,
          StartSizeGB = round(StartSizeBytes / 1e9, 1),
          CurrentSizeGB = round(CurrentSizeBytes / 1e9, 1),
          GrowthGB = round(GrowthBytes / 1e9, 1),
          GrowthPct = iff(StartSizeBytes > 0, round(GrowthBytes * 100.0 / StartSizeBytes, 1), real(null))
| order by CurrentSizeGB desc;
// Daily size series for those top 5 accounts
DailyStats
| join kind=inner (Top5Largest) on StorageAccount
| project StorageAccount, Day, DailyMaxSizeGB = round(DailyMaxSize / 1e9, 1)
| order by StorageAccount asc, Day asc;
Purpose: Compare start versus current size for the largest five storage accounts.
Why Useful: It combines scale and growth to reveal where most data volume sits.
Benefit: Teams can focus optimization work on the biggest and fastest-changing accounts.
4) 30-day growth forecast for top 5 accounts
// This query calculates the average daily growth velocity in GB for the top 5 storage accounts with the highest growth over the past 30 days, and then forecasts their size in 30 days based on that velocity.

let DailyStats =
    blobmonitor_CL
    | where TimeGenerated > ago(30d)
    | where SizeInBytes != 0 and SizeInBytes != 1
    | summarize DailyMaxSize = max(SizeInBytes), DailyMinSize = min(SizeInBytes) by StorageAccount, Day = bin(TimeGenerated, 1d)
    | order by StorageAccount asc, Day asc
    | serialize
    | extend DailyDifference = DailyMaxSize - DailyMinSize;
let GrowthStats =
    DailyStats
    | extend PrevAccount = prev(StorageAccount)
    | extend PrevDailyMaxSize = prev(DailyMaxSize)
    | extend PreviousDayMaxSize = iif(StorageAccount == PrevAccount, PrevDailyMaxSize, long(null))
    | extend GrowthFromPreviousDay = DailyMaxSize - PreviousDayMaxSize;
let TopAccounts =
    GrowthStats
    | summarize TotalGrowth = sum(GrowthFromPreviousDay) by StorageAccount
    | top 5 by TotalGrowth desc;
let CurrentSizes =
    DailyStats
    | summarize arg_max(Day, *) by StorageAccount
    | project StorageAccount, CurrentSizeGB = round(DailyMaxSize / 1e9, 1);
GrowthStats
| join kind=inner (TopAccounts) on StorageAccount
| project StorageAccount, Day, DailyDifferenceGB = DailyDifference / 1e9
| order by StorageAccount asc, Day asc
| summarize StorageVelocityGBPerDay = round(avg(DailyDifferenceGB), 1) by StorageAccount
| join kind=inner (CurrentSizes) on StorageAccount
| extend ForecastedGrowthNext30DaysGB = StorageVelocityGBPerDay * 30
| extend SizeGBIn30Days = CurrentSizeGB + ForecastedGrowthNext30DaysGB
| order by ForecastedGrowthNext30DaysGB desc
| project-away StorageVelocityGBPerDay,StorageAccount1,ForecastedGrowthNext30DaysGB;
Purpose: Estimate 30-day future size using current growth velocity for top growth accounts.
Why Useful: It provides a simple near-term forecast from observed daily behavior.
Benefit: Teams can proactively plan budgets and thresholds before size spikes happen.
🔄 Transaction Volume & Costs💰
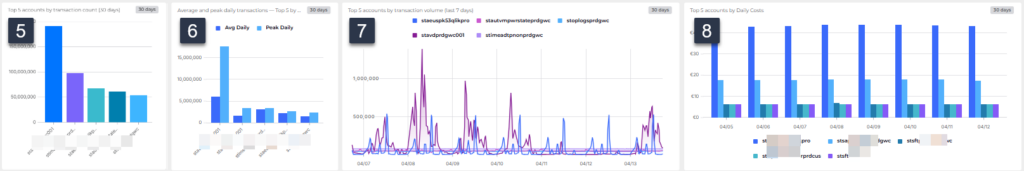
5) Top 5 accounts by transaction count (30 days)
// This identifies the top 5 storage accounts with the highest total transactions over the past 30 days.

blobmonitor_CL
    | where TimeGenerated > ago(30d)
    | summarize TotalTransactions = sum(Transactions) by StorageAccount
    | top 5 by TotalTransactions desc
    | project StorageAccount, TotalTransactions
Purpose: Identify the five storage accounts with the highest 30-day transaction totals.
Why Useful: It surfaces the busiest accounts that drive workload intensity.
Benefit: Teams can target performance tuning and monitoring on high-traffic accounts.
6) Average and peak daily transactions — Top 5 by PeakDaily (last 30 days)
// Calculates the average daily transactions and peak daily transactions for storage accounts over the past 30 days, and identifies the top 5 accounts by peak daily transactions.

let Daily30d =
    blobmonitor_CL
    | where TimeGenerated > ago(30d)
    | summarize DailyTransactions = sum(Transactions) by StorageAccount, Day = bin(TimeGenerated, 1d);
Daily30d
| summarize AvgDaily = round(avg(DailyTransactions), 1), PeakDaily = max(DailyTransactions) by StorageAccount
| top 5 by PeakDaily desc
| order by PeakDaily desc;
Purpose: Show average and peak daily transaction behavior across storage accounts.
Why Useful: It reveals both normal load and burst load patterns in one view.
Benefit: Teams can size throughput settings with better confidence.
7) Top 5 accounts by transaction volume (last 7 days)
// Identifies the top 5 storage accounts with the highest total transactions over the past 7 days, excluding certain accounts based on their names, and then retrieves their daily transactions for that period.

let Top5AccountsByTransactions =
    blobmonitor_CL
    | where TimeGenerated > ago(7d)
    | where SizeInBytes !=0
    | where SizeInBytes !=1
    | summarize TotalTransactions = sum(Transactions) by StorageAccount
    | top 5 by TotalTransactions desc
    | project StorageAccount;
blobmonitor_CL
| where TimeGenerated > ago(7d)
| where not (StorageAccount matches regex "vmva|veeam|spk10delin|blb0|migrate" )
| where StorageAccount in (Top5AccountsByTransactions)
| where Transactions !=0
| where Transactions !=1
| project TimeGenerated, StorageAccount, Transactions
Purpose: Track daily transactions for the top five most active accounts over the last week.
Why Useful: It narrows analysis to current high-activity accounts.
Benefit: Teams can quickly detect short-term usage shifts and operational anomalies.
8) Top 5 accounts by Daily Costs
// Identifies the top 5 storage accounts with the highest average daily cost in EUR over the past 8 days (excluding the most recent day), and then retrieves their daily average cost for that period.

let top5sta =
blobmonitor_CL
| where TimeGenerated between (ago(8d) .. ago(1d))
| where isnotempty(DailyCostAvgEUR)
| where not (StorageAccount matches regex "vmva|veeam|spk10delin|blb0|migrate" )
| extend DailyCostAvgEURLng = todouble(DailyCostAvgEUR)
| extend DailyCostAvgEURRnd = round(DailyCostAvgEURLng,2)
| where DailyCostAvgEURRnd != 0
| summarize arg_max(TimeGenerated,*) by StorageAccount, DailyCostAvgEURRnd
| summarize max(DailyCostAvgEURRnd) by StorageAccount
| top 5 by max_DailyCostAvgEURRnd
| project StorageAccount;
blobmonitor_CL
| where TimeGenerated between(ago(8d) .. ago(1d))
| where isnotempty(DailyCostAvgEUR)
| where StorageAccount in(top5sta)
| extend DailyCostAvgEURLng = todouble(DailyCostAvgEUR)
| extend DailyCostAvgEURRnd = round(DailyCostAvgEURLng,2)
| where DailyCostAvgEURRnd != 0
| summarize arg_max(DailyCostAvgEURRnd,StorageAccount) by StorageAccount, bin(TimeGenerated,1d)
Purpose: Find the top five highest-cost storage accounts and show daily cost values.
Why Useful: It separates cost hotspots from lower-impact accounts.
Benefit: Teams can focus cost optimization where savings potential is greatest.
🔒 Security & Compliance⚖️
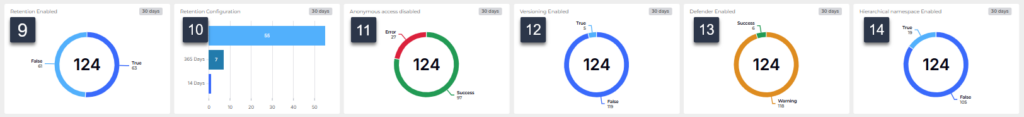
9) Retention Enabled
// This query counts the number of unique storage accounts that have retention enabled in the past hour.

blobmonitor_CL
| where TimeGenerated > ago(1h)
| summarize dcount(StorageAccount) by IsRetentionEnabled
Purpose: Count unique storage accounts grouped by retention-enabled state.
Why Useful: It provides a quick compliance snapshot for retention settings.
Benefit: Teams can spot policy drift and address gaps faster.
10) Retention Configuration
// This query counts the number of unique storage accounts by retention days for those that have retention enabled in the past 24 hours.

blobmonitor_CL
| where TimeGenerated > ago(24h)
| where IsRetentionEnabled == "True"
| summarize dcount(StorageAccount) by strcat(RetentionDays, " Days")
Purpose: Count unique retention-enabled accounts by configured retention days.
Why Useful: It shows how retention duration is distributed across accounts.
Benefit: Teams can validate policy consistency and standardization.
11) Anonymous access disabled
// This query counts the number of unique storage accounts that have anonymous access enabled in the past hour.

blobmonitor_CL
| where TimeGenerated > ago(1h)
| summarize dcount(StorageAccount) by IsAnonymousAccessEnabled
Purpose: Count unique storage accounts by anonymous access enabled status.
Why Useful: It highlights exposure risk related to public data access.
Benefit: Teams can prioritize remediation for weaker access posture.
12) Versioning Enabled
// This query counts the number of unique storage accounts that have versioning enabled in the past 24 hours.

blobmonitor_CL
| where TimeGenerated > ago(24h)
| summarize dcount(StorageAccount) by IsVersioningEnabled
Purpose: Count unique storage accounts by versioning enabled status.
Why Useful: It verifies coverage of a key data protection feature.
Benefit: Teams can reduce recovery risk by improving versioning adoption.
13) Defender Enabled
// This query counts the number of unique storage accounts that have Defender enabled in the past 24 hours.

blobmonitor_CL
| where TimeGenerated > ago(24h)
| summarize dcount(StorageAccount) by IsDefenderEnabled
Purpose: Count unique storage accounts by Defender enabled status.
Why Useful: It gives visibility into security control adoption.
Benefit: Teams can close security monitoring gaps more quickly.
14) Hierarchical namespace Enabled
// This query counts the number of unique storage accounts that have Defender enabled in the past 24 hours.

blobmonitor_CL
| where TimeGenerated > ago(24h)
| summarize dcount(StorageAccount) by HierarchicalNamespaceEnabled
Purpose: Count unique storage accounts by hierarchical namespace enabled status.
Why Useful: It shows adoption of Data Lake namespace capability.
Benefit: Teams can align feature rollout with analytics and data engineering needs.
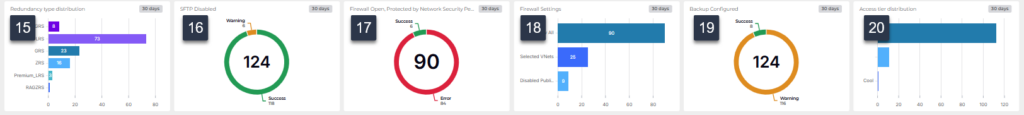
15) Redundancy type distribution
// This query counts the number of unique storage accounts that have hierarchical namespace enabled in the past 24 hours

blobmonitor_CL
| where TimeGenerated > ago(24h)
| summarize dcount(StorageAccount) by replace("Standard_","", RedundancyType)
Purpose: Count unique storage accounts grouped by normalized redundancy type.
Why Useful: It summarizes resilience configuration across the environment.
Benefit: Teams can verify redundancy alignment with business continuity targets.
16) SFTP Disable
// This query counts the number of unique storage accounts that have hierarchical namespace enabled in the past 24 hours.

blobmonitor_CL
| where TimeGenerated > ago(24h)
| summarize dcount(StorageAccount) by IsSFTPEnabled
Purpose: Count unique storage accounts by SFTP enabled status.
Why Useful: It provides a quick view of managed file transfer surface area.
Benefit: Teams can manage secure transfer governance more effectively.
17) Firewall Open, Protected by Network Security Perimeter
// This query counts the number of unique storage accounts that have firewall settings allowing all networks in the past hour.

blobmonitor_CL
| where TimeGenerated > ago(1h)
| where FirewallSettings == "all networks allowed"
| summarize StorageAccounts=dcount(StorageAccount) by NetSecPerimeter=NetworkSecurityPerimeterProvisioningState
Purpose: Count accounts allowing all networks and group by perimeter provisioning state.
Why Useful: It identifies potentially overexposed firewall configurations.
Benefit: Teams can reduce network risk by tightening open access settings.
18) Firewall Settings
// This query counts the number of unique storage accounts grouped by normalized firewall settings in the past 24 hours. It normalizes various firewall setting descriptions into standardized categories for clearer analysis.

blobmonitor_CL
| where TimeGenerated > ago(24h)
| extend _norm = trim(" ", tolower(tostring(FirewallSettings)))
| extend FirewallNormalized = case(
        _norm == "all networks allowed",                     "Allow All",
        _norm == "disabled",                                 "Disabled Public Access",
        _norm == "selected virtual networks and ip addresses","Selected VNets",
        _norm == "allowall",                                 "Allow All",
        _norm == "denyall",                                  "Disabled Public Access",
        _norm startswith "vnet",                             "Selected VNets",
        _norm startswith "ip",                               "Selected VNets",
        _norm == "",                                         "Unknown",
        "Other"
    )
| summarize dcount(StorageAccount) by FirewallNormalized
Purpose: Count unique storage accounts by normalized firewall settings.
Why Useful: It simplifies diverse firewall setting descriptions into consistent groups.
Benefit: Teams can more easily understand and act on firewall configuration patterns.
19) Backup configured
// This query counts the number of unique storage accounts that are configured for backup in the past 24 hours

blobmonitor_CL
| where TimeGenerated > ago(24h)
| summarize dcount(StorageAccount) by IsConfiguredForBackup
Purpose: Count unique storage accounts by backup configuration status.
Why Useful: It quickly shows backup coverage across monitored accounts.
Benefit: Teams can improve recoverability by addressing unprotected accounts.
20) Access tier distribution
// This query counts the number of unique storage accounts by access tier in the past 24 hours

blobmonitor_CL
| where TimeGenerated > ago(24h)
| summarize dcount(StorageAccount) by AccessTier
Purpose: Count unique storage accounts grouped by access tier.
Why Useful: It provides a duplicate tier view for validation or alternate visuals.
Benefit: Teams can cross-check tier distribution outputs quickly.
Dashboard Software
SquaredUp Cloud is a SaaS-based operational intelligence platform that delivers unified visibility across on premises and cloud environments. It connects to various data sources and infrastructure monitoring systems, and provides flexible drag and drop dashboards, real time monitoring, RollUp status summaries, and built in sharing and analytics.
For this project, I used the Azure plugin exclusively.
Conclusion
This solution demonstrates how Azure Storage account insights can be derived by combining structured data collection with focused KQL analysis, rather than relying on fragmented portal views. By centralizing inventory, growth trends, transaction behavior, cost data, and configuration state into Log Analytics, the dashboard enables consistent and repeatable analysis across subscriptions.
The PowerShell runbook and supporting queries provide a transparent data pipeline: collection, normalization, ingestion, and analysis are all explicit and inspectable. This makes the approach suitable not only for visualization, but also for validation, governance reviews, and capacity or cost assessments. The result is a foundation that can be extended with additional signals or controls as requirements evolve—without changing the underlying data model or collection pattern.